


When Does the Forex Market Close and Open? Find Out the Trading Hours
When does the forex market close? If you’re new to forex trading, one of the important things to understand is the trading hours of the forex market. …
Read Article
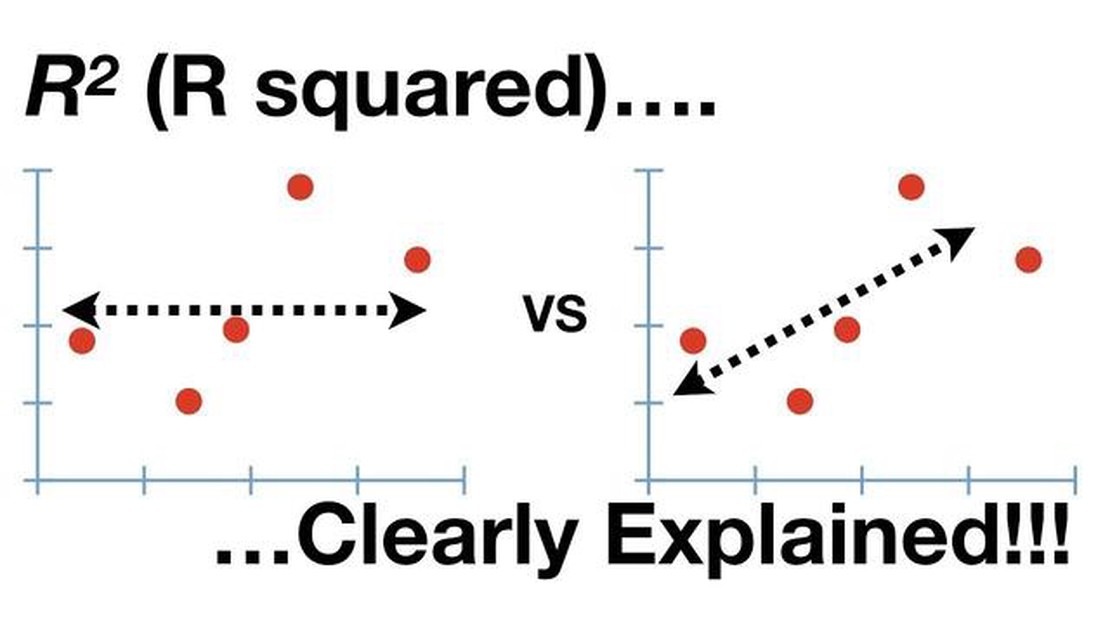
When it comes to trading, one of the most important metrics that traders use to evaluate the performance of a stock or a trading strategy is the R2 value. The R2 value, also known as the coefficient of determination, is a statistical measure that indicates the proportion of the variance in the dependent variable that is predictable from the independent variable(s). In simpler terms, it tells us how well the independent variable(s) can explain the movement in the dependent variable.
The R2 value ranges from 0 to 1, where 0 indicates that the independent variable(s) cannot explain any of the movement in the dependent variable, and 1 indicates that the independent variable(s) can perfectly explain the movement in the dependent variable. Traders often look for stocks or trading strategies with high R2 values, as they are more likely to have a stronger relationship between the independent and dependent variables.
It is important to note that a high R2 value does not necessarily mean that the relationship between the independent and dependent variables is causal. Correlation does not imply causation, and traders must be cautious not to make any causal assumptions based solely on a high R2 value. However, a high R2 value does indicate a strong statistical relationship, which can be useful for traders in making informed trading decisions.
Traders can use the R2 value in a variety of ways. They can compare the R2 values of different stocks or trading strategies to determine which ones have a stronger relationship between the independent and dependent variables. They can also use the R2 value to assess the effectiveness of a trading strategy over time, or to identify periods of the market when the strategy may be less effective due to changes in the relationship between variables.
In conclusion, understanding the R2 value is crucial for traders in evaluating the performance of stocks and trading strategies. It provides valuable insight into the relationship between independent and dependent variables and can help traders make more informed trading decisions. However, traders must also be cautious not to make causal assumptions based solely on a high R2 value, as correlation does not imply causation. Utilizing the R2 value in conjunction with other technical and fundamental analysis tools can give traders a more comprehensive understanding of the market.
R2, also known as the coefficient of determination or the R-squared, is a statistical measure that quantifies the proportion of the variance in a dependent variable that can be explained by the independent variables. In trading, R2 is commonly used to assess the goodness of fit of a linear regression model to historical data.

R2 ranges from 0 to 1, with 1 indicating a perfect fit. A value close to 0 signifies a poor fit, meaning the independent variables do not explain much of the variance in the dependent variable. R2 can be interpreted as the percentage of the variance in the dependent variable that is predictable from the independent variables.
One important thing to note about R2 is that it does not indicate the causality or the direction of the relationship between the independent and dependent variables. It only measures how well the regression model fits the data. Therefore, it is necessary to analyze other statistical measures and conduct further analysis to draw meaningful conclusions about the relationship between the variables.
In trading, R2 can be useful for evaluating the performance of trading strategies, especially those that rely on linear regression models. By examining the R2 value, traders can determine the extent to which the historical data supports the assumptions and predictions made by the model. It can also help traders identify areas for improvement and potential problems with their strategies.
In summary, R2 is a statistical measure that assesses the goodness of fit of a linear regression model. It indicates the proportion of the variance in the dependent variable that can be explained by the independent variables. While R2 is a useful tool, it should be used in conjunction with other statistical measures and analysis to gain a comprehensive understanding of the relationship between variables in trading.
Read Also: Forex Trading: How Much is Traded Annually in the Forex Market?
R2, or the coefficient of determination, is an important metric in trading because it provides insights into the effectiveness of a trading strategy or model.
When it comes to trading, investors and traders use various strategies and models to predict the direction of the market or the performance of a stock. The R2 value helps assess the accuracy and reliability of these predictions.
R2 ranges from 0 to 1, with 1 indicating a perfect fit and 0 indicating no relationship between the predicted and actual values.
By analyzing the R2 value, traders can determine:
Read Also: Understanding 1 Lot in Options Trading: A Comprehensive Guide
1. Accuracy of predictions: A higher R2 value indicates a stronger linear relationship between the predicted and actual values, suggesting higher accuracy in predictions. This helps traders gain confidence in their trading strategy and make informed decisions.
2. Reliability of models: R2 also helps traders measure the reliability of their trading models. A high R2 value suggests that the model is able to explain a significant portion of the variability in the data, indicating that the model is reliable and robust.
3. Comparison of different strategies: By comparing the R2 values of different strategies or models, traders can identify the most effective approach. The higher the R2 value, the more reliable and accurate the strategy is likely to be.
Overall, R2 is an essential metric in trading as it provides valuable insights into the accuracy and reliability of trading strategies and models. By understanding the R2 value, traders can improve their decision-making process and potentially achieve better trading outcomes.

R2 in trading refers to the coefficient of determination, which is a statistical measure that indicates the proportion of the variance in the dependent variable that can be explained by the independent variables in a regression model. It ranges from 0 to 1, with 1 representing a perfect fit. This measure is commonly used to assess the goodness of fit of a trading model and determine how well it explains the movements in the financial market.
R2 is calculated by taking the sum of the squares of the differences between the actual values and the predicted values from a regression model, and dividing it by the sum of the squares of the differences between the actual values and the mean of the dependent variable. The result is then subtracted from 1 to obtain the R2 value. In trading, R2 can be calculated using software or programming languages that have statistical packages or libraries.
R2 is important in trading as it provides a measure of how well a trading model fits the data and explains the movements in the financial market. A higher R2 value indicates a stronger relationship between the independent variables and the dependent variable, suggesting that the model is doing a better job of capturing the underlying patterns and trends. Traders and analysts can use R2 to assess the effectiveness of their trading strategies and make informed decisions based on the model’s performance.
No, R2 cannot be negative in trading. The coefficient of determination (R2) always ranges from 0 to 1, where 1 represents a perfect fit and 0 represents no relationship between the independent and dependent variables. A negative R2 value would imply that the model is performing worse than simply using the mean of the dependent variable to make predictions. In trading, a negative R2 would suggest that the trading model is not capturing any meaningful patterns or trends in the market.

When does the forex market close? If you’re new to forex trading, one of the important things to understand is the trading hours of the forex market. …
Read Article
Best Leverage for $300: Your Ultimate Guide When it comes to investing, one of the key strategies is leveraging. By using leverage, investors can …
Read Article
The Most Reliable Candlestick Pattern in Forex When it comes to trading in the forex market, having a reliable strategy is essential. One of the most …
Read Article
MF Global Losses: A Closer Look at the Financial Fallout In the world of finance, few events have captured as much attention and controversy as the …
Read Article
Top Brokers for Scalping Trading Scalping trading is a popular strategy among traders who aim to make quick and frequent trades to profit from small …
Read Article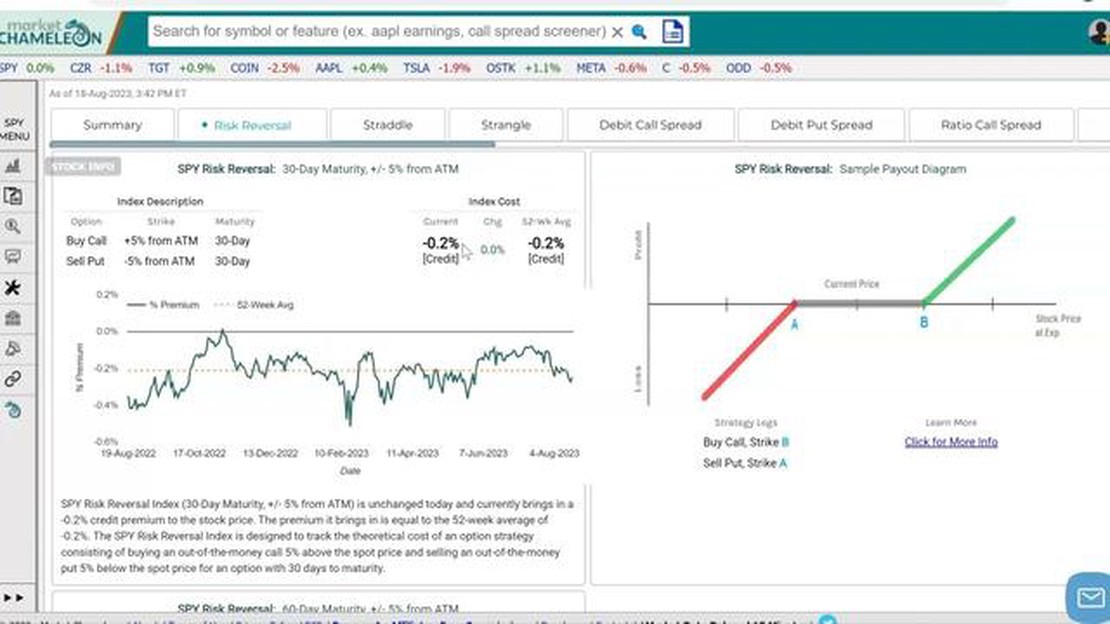
What is risk reversal option strategy? When it comes to financial investments, there are various strategies that investors can employ to mitigate risk …
Read Article


