


Understanding the Role of a Bank's Forex Department: Explained
What is the role of a bank’s forex department? A bank’s forex department plays a crucial role in conducting foreign exchange transactions and managing …
Read Article

Calculating the Relative Strength Index (RSI) moving average is an essential tool for traders looking to gauge the strength and momentum of a financial asset over a given period of time. RSI is a technical indicator used in the analysis of financial markets to help identify overbought or oversold conditions.
To calculate the RSI moving average, you will need to determine the RSI value for each period and then take the average of these values over a specific number of periods. The RSI is calculated based on the average gain and average loss of a financial asset over a certain time frame.
The RSI moving average can be calculated using various methods, such as the simple moving average (SMA) or the exponential moving average (EMA). The SMA calculates the average of the RSI values over a specific number of periods, while the EMA assigns more weight to recent RSI values.
By calculating the RSI moving average, traders can gain valuable insights into the overall trend and momentum of a financial asset. This can help them make more informed trading decisions and potentially profit from market movements. It is important to note that the RSI moving average should be used in conjunction with other technical indicators and analysis methods to maximize its effectiveness.
RSI (Relative Strength Index) Moving Average is used to analyze and track the momentum of a financial instrument’s price movement over a specific period of time. It is widely used by traders and investors to identify potential market trends and make informed trading decisions.
RSI is calculated based on the average gain and average loss of an asset’s price over a specific period of time. The formula for RSI involves dividing the average gain by the average loss and then applying it to a 0-100 scale.
By adding a moving average to the RSI calculation, traders can smooth out the data over a longer period of time and eliminate any short-term fluctuations that may affect the accuracy of the indicator. This helps to provide a clearer picture of the market trend and potential reversal points.
The RSI Moving Average is commonly used in technical analysis to determine potential overbought and oversold conditions in the market. When the RSI crosses above the moving average, it signals a bullish trend, while a cross below the moving average suggests a bearish trend.
Traders often use the RSI Moving Average in combination with other technical indicators to confirm trading signals and validate market trends. This indicator should not be used as the sole basis for making trading decisions, but rather as a tool to supplement other analysis methods.

It is important to note that the RSI Moving Average is not a guaranteed predictor of future price movements. Like any other technical indicator, it has its limitations and should be used in conjunction with fundamental analysis and risk management strategies.
Overall, understanding the RSI Moving Average can provide valuable insights into market trends and potential reversals, helping traders and investors make more informed decisions in their trading activities.
Read Also: Exploring the Mechanics of Leap Options: How They Work and What You Need to Know
RSI (Relative Strength Index) is a popular technical analysis indicator used to measure the magnitude and velocity of price movements. It helps traders identify overbought and oversold conditions in the market. Developed by J. Welles Wilder Jr., the RSI is a momentum oscillator that oscillates between 0 and 100.
The RSI calculates the relative strength of an asset by comparing the average gain and average loss over a specific time period, typically 14 days. It is often displayed as a line graph plotted beneath the price chart.
The RSI is considered overbought when it reaches or exceeds 70, indicating that the asset may be due for a price reversal or correction. Conversely, an RSI reading below 30 is considered oversold, suggesting that the asset may be undervalued and due for a potential rally.
Traders often use the RSI to confirm trends, generate buy or sell signals, and identify potential divergence between the RSI and price movements. It is a versatile tool that can be applied to different timeframes and financial instruments, making it popular among traders of stocks, forex, cryptocurrencies, and more.
Disclaimer: The RSI is just one of many indicators used in technical analysis and should not be relied upon solely for trading decisions. It is important to consider other factors and indicators before making any investment choices.
Moving Average is a commonly used technical indicator in financial analysis. It is a calculation that helps reduce noise and smooth out price data over a specified time period. Moving Average is often used to identify trends and generate buy or sell signals in trading strategies.
Read Also: Mastering Moving Average in Data Analysis: Techniques and Tips
The calculation of Moving Average involves taking the average of a set of values over a specific time period. The time period can be short-term, such as 10 days, or long-term, such as 200 days. The longer the time period, the smoother the Moving Average will be.
There are different types of Moving Averages, such as Simple Moving Average (SMA) and Exponential Moving Average (EMA). SMA calculates the average of a set of values by simply adding them up and dividing by the number of values. EMA, on the other hand, gives more weight to recent values, making it more responsive to price changes.

Moving Average is often used in conjunction with other technical indicators to confirm trading signals. For example, when the price of an asset crosses above its Moving Average, it could be a bullish signal indicating a possible uptrend. Conversely, when the price crosses below the Moving Average, it could be a bearish signal indicating a possible downtrend.
Overall, Moving Average is a powerful tool for traders and investors to analyze price movements and make informed decisions. It helps to smooth out price data, identify trends, and generate trading signals, thereby assisting in the development of profitable trading strategies.
RSI stands for Relative Strength Index. It is a momentum oscillator that measures the speed and change of price movements. It helps traders identify overbought and oversold conditions in the market.
RSI is calculated using the average gain and average loss over a specific period of time. The formula involves dividing the average gain by the average loss and applying a smoothing factor to normalize the values.
The RSI moving average is a trend-following indicator derived from the RSI calculation. It smooths out the RSI values over a specified period to help traders identify longer-term trends.
To calculate the RSI moving average, you first need to calculate the RSI values. Then, you can apply a moving average formula, such as the simple moving average or exponential moving average, to smooth out the RSI values over a specified period.
Calculating the RSI moving average can help traders identify the overall trend and momentum in the market. It can provide additional confirmation for trading signals generated by the RSI indicator.
RSI, or Relative Strength Index, is a technical indicator used in trading to measure the speed and change of price movements. It oscillates between 0 and 100 and is commonly used to identify overbought or oversold conditions in the market.

What is the role of a bank’s forex department? A bank’s forex department plays a crucial role in conducting foreign exchange transactions and managing …
Read Article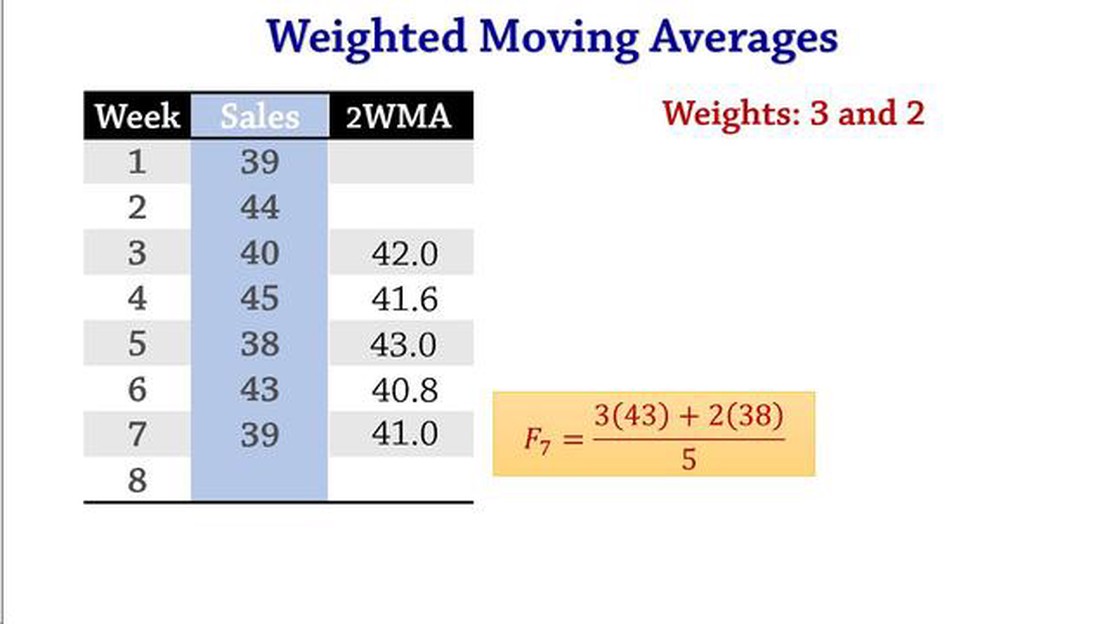
Guide to Weighted Moving Average Forecasting Accurate forecasting is crucial for businesses in making informed decisions and planning for the future. …
Read Article
Understanding IRS Taxation of Options Options are a popular investment vehicle that allow individuals to speculate on the future price movements of …
Read Article
RBI Guidelines for Risk Management The Reserve Bank of India (RBI) is the central banking institution of India and plays a crucial role in maintaining …
Read Article
How to Buy Forex Trading: A Step-by-Step Guide Forex trading, also known as foreign exchange trading, is a popular investment option for both …
Read Article
What is the currency in the British Virgin Islands? The British Virgin Islands (BVI) is a stunning Caribbean destination known for its pristine …
Read Article


