


Can I exchange currency in BOI? Here's everything you need to know
Can I exchange currency in BOI? If you are traveling to a different country, one of the important things to consider is the exchange of currency. …
Read Article
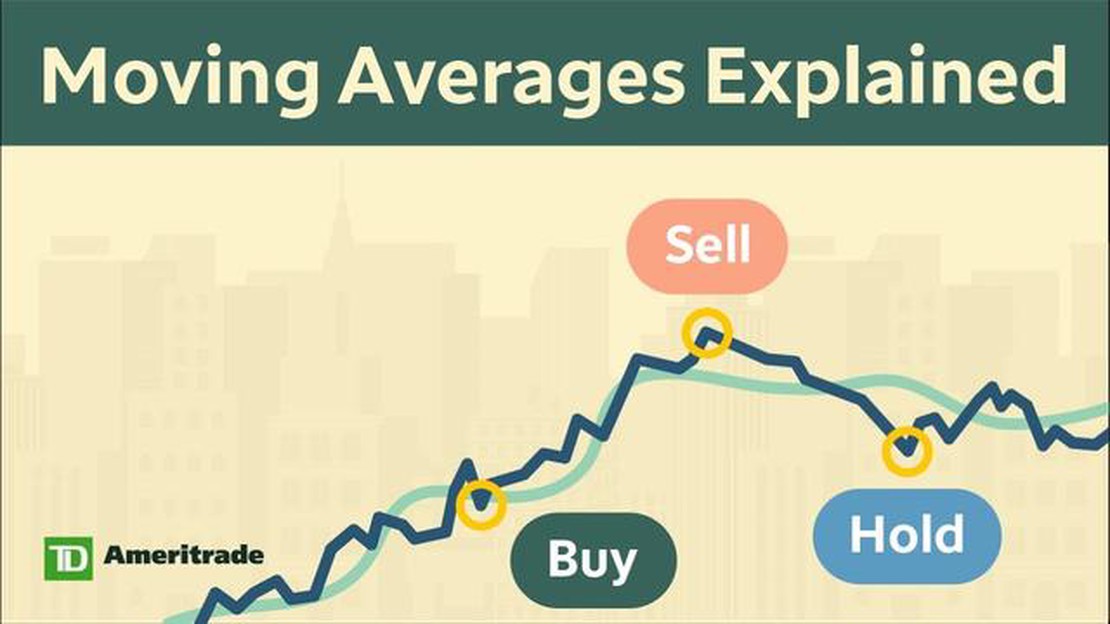
The moving average is a widely used statistical technique in data analysis that helps in smoothing out fluctuations and revealing underlying trends or patterns in a dataset. It is particularly useful when dealing with time series data, where the values change over time.
By calculating the average of a series of data points within a specified window, the moving average provides a more accurate representation of the overall trend. This allows analysts to make better-informed decisions and predictions based on the data.
There are various techniques and tips that can enhance the effectiveness of using moving averages in data analysis. One such technique is the weighted moving average, which assigns different weights to each data point within the window based on its significance. This can give more weight to recent data points and reduce the impact of older ones, resulting in a smoother and more accurate trend line.
Another tip is to experiment with different window sizes to find the optimal length that captures the desired level of detail in the data. A smaller window size will capture short-term fluctuations, while a larger window size will smooth out noise and reveal long-term trends. Additionally, using multiple moving averages with different window sizes can provide a more comprehensive analysis of the data.
“The moving average is a powerful tool in data analysis that can uncover valuable insights and trends. By mastering various techniques and tips, analysts can effectively utilize this technique to make informed decisions and predictions based on the data at hand.”
In conclusion, the moving average is a fundamental technique in data analysis that can help uncover trends and patterns in a dataset. Through the use of different techniques, such as weighted moving averages, and experimenting with various window sizes, analysts can enhance the accuracy and effectiveness of the moving average in their analysis. By mastering this technique, analysts can gain valuable insights from their data and make better-informed decisions.
Moving average is a statistical calculation used to analyze data over a certain period of time. It is often used in data analysis to smooth out fluctuations and identify trends or patterns in the data.
The moving average is calculated by taking the average of a certain number of data points within a specific time frame. The number of data points and the time frame used in the calculation can vary depending on the application and the data being analyzed.
The moving average is important because it helps to reduce noise or random fluctuations in the data, making it easier to identify underlying trends or patterns. It is commonly used in finance and economics to analyze stock prices, market trends, and economic indicators.

In addition to its role in identifying trends, the moving average can also be used to forecast future values based on historical data. By analyzing the trend of the moving average over time, it is possible to predict future values and make informed decisions.
Overall, the moving average is a valuable tool in data analysis as it helps to simplify complex data sets, highlight important trends, and make predictions. It is widely used across various industries and is an essential technique for any data analyst or researcher.
The moving average is a popular statistical tool used to analyze time series data. It helps to smooth out fluctuations in data and identify trends or patterns. There are several techniques for calculating moving averages, each with its own advantages and disadvantages.
| Technique | Description |
|---|---|
| Simple Moving Average (SMA) | The SMA is calculated by taking the average of a specified number of data points over a given time period. It gives equal weightage to each data point and provides a basic representation of the overall trend. |
| Weighted Moving Average (WMA) | The WMA assigns different weights to each data point based on their significance. This technique gives more weight to recent data points and less weight to older data points, allowing for a more responsive moving average. |
| Exponential Moving Average (EMA) | The EMA is similar to WMA but places more emphasis on recent data points. It assigns exponentially decreasing weights to older data points, resulting in a smoother moving average that is more sensitive to recent changes. |
| Adaptive Moving Average (AMA) | The AMA adjusts its parameters based on market conditions, making it more adaptable to changing trends. It uses a combination of linear regression and moving averages to dynamically adjust the smoothing factor. |
Read Also: Discover the Most Efficient Day Trading Strategy for Maximum Profit
When choosing a technique for calculating moving averages, it is important to consider the characteristics of the data and the purpose of the analysis. Each technique has its own limitations and may be more suitable for certain types of data or analysis goals.
By understanding the different techniques for calculating moving averages, data analysts can effectively apply this statistical tool in their analysis and gain meaningful insights from time series data.
The moving average is a widely used statistical calculation in data analysis that helps to identify trends and patterns in a dataset. There are different types of moving averages commonly used, but two of the most popular ones are the Simple Moving Average (SMA) and the Exponential Moving Average (EMA).
The Simple Moving Average (SMA) is the most straightforward moving average calculation. It is calculated by taking the average of a fixed number of data points over a specific period of time. For example, a 10-day SMA will calculate the average of the last 10 days’ closing prices.
Read Also: Is currency exchange available at Kolkata airport?
The SMA gives equal weight to each data point in the calculation, which means that all data points have the same importance in determining the average. This can be beneficial for smoothing out short-term fluctuations and providing an overall trend of the data.
On the other hand, the Exponential Moving Average (EMA) places more weight on recent data points and less weight on older ones. This is achieved by using a smoothing factor in the calculation, which gives more significance to the most recent observations. As a result, the EMA reacts more quickly to price changes compared to the SMA.
The EMA is particularly useful in detecting short-term trends and generating trading signals. Traders often use the EMA in conjunction with other technical indicators to determine buy or sell signals.
| Simple Moving Average (SMA) | Exponential Moving Average (EMA) |
|---|---|
| Calculates the average of a fixed number of data points over a specific period of time. | Places more weight on recent data points and less weight on older ones. |
| Gives equal weight to each data point. | Uses a smoothing factor to give more significance to recent observations. |
| Smoothes out short-term fluctuations and provides an overall trend. | React more quickly to price changes and can be useful in generating trading signals. |

In conclusion, both SMA and EMA are valuable tools in data analysis. The choice between the two depends on the specific needs and goals of the analysis. The SMA is better suited for identifying long-term trends, while the EMA is more suitable for detecting short-term fluctuations and generating trading signals.
A moving average is a statistical technique used to analyze data and identify trends or patterns by calculating the average of a specific number of data points within a given time frame.
A moving average is calculated by taking the average of a set of data points within a specific time frame. It involves adding up the values of the data points and then dividing by the number of data points included in the calculation.
There are several advantages of using a moving average in data analysis. It helps to smooth out the noise and randomness in the data, making it easier to identify trends or patterns. It also helps in predicting future values based on past data and can be used to identify potential turning points in a time series.
Some commonly used moving average techniques include simple moving average (SMA), weighted moving average (WMA), and exponential moving average (EMA). SMA gives equal weight to all data points, WMA assigns different weights to different data points, and EMA puts more weight on recent data points.
A moving average is a statistical technique that is used to analyze time series data by calculating the average of a specified number of preceding and succeeding values in a time series.
Moving averages are often used in data analysis because they provide a smoother representation of the underlying trends and patterns in the data. They can help to filter out noise and make it easier to identify long-term trends.

Can I exchange currency in BOI? If you are traveling to a different country, one of the important things to consider is the exchange of currency. …
Read Article
Revenue of FlexTrade: Explained FlexTrade is a leading global financial technology company that provides multi-asset trading solutions to buy-side and …
Read Article
Understanding Compensation Rates: When it comes to understanding compensation rates, there are a few key factors that every employee and employer …
Read Article
Is JustMarkets a trusted broker? If you’re considering investing in the financial markets, it’s crucial to choose a trustworthy broker that …
Read Article
Is Dukascopy a true ECN? Dukascopy is a well-known name in the forex industry, offering a variety of trading services to clients around the world. One …
Read Article
Is Forex Legal: Understanding the Legality of Forex Trading Forex trading, also known as foreign exchange trading, has gained immense popularity in …
Read Article


