


Understanding the Meaning and Significance of TND Currency
Understanding the Meaning of TND Currency The TND currency, also known as the Tunisian Dinar, is the official currency of Tunisia. It holds great …
Read Article
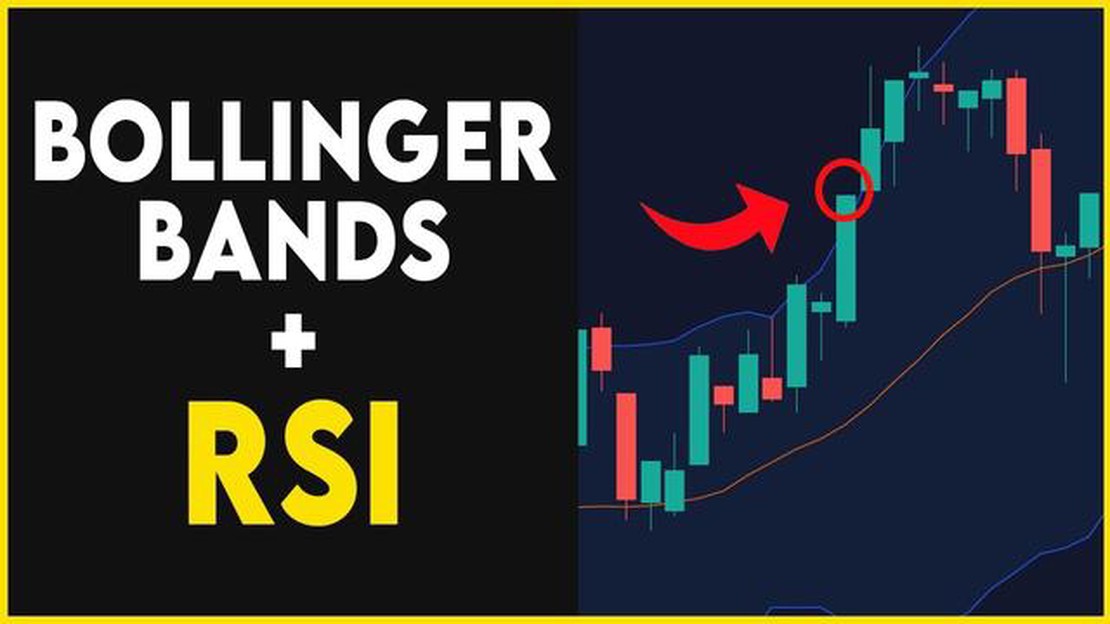
Bollinger Bands are a popular technical analysis tool used by traders to identify potential price reversals and analyze market volatility. They consist of a moving average line and two standard deviation lines, creating a band around the price chart. By monitoring how the price interacts with these bands, traders can gain valuable insights into the stock’s trend and potential trading opportunities.
When it comes to screening stocks using Bollinger Bands, there are several effective strategies that traders can employ:
By using Bollinger Bands to screen stocks, traders can refine their trading strategies and identify potential opportunities in the market. However, it’s important to remember that technical analysis tools should not be used in isolation, and other factors such as fundamental analysis and market conditions should also be considered.
It’s recommended to thoroughly backtest and validate any trading strategy before executing it with real money. Additionally, it’s crucial to manage risk properly and always be prepared for unexpected market movements.
In conclusion, Bollinger Bands can be a valuable tool for traders looking to screen stocks and develop effective trading strategies. By analyzing how the price interacts with the bands, traders can gain insights into the stock’s trend and potential price reversals. Whether employing the “bounce off the bands,” “breakout above the bands,” “range contraction,” or “volatility squeeze” strategy, it’s important to combine technical analysis with other methods and thoroughly test any strategy before implementation.
The middle band is a simple moving average (SMA) and represents the average price of the stock over a specified period of time. The upper band is calculated by adding two standard deviations of the stock’s price to the middle band, while the lower band is calculated by subtracting the same value from the middle band.
The distance between the upper and lower bands is known as the band width, which reflects the volatility of the stock. When the band width is narrow, it indicates low volatility, while a wide band width suggests high volatility.
Bollinger Bands are often used to identify potential price reversals and trading opportunities. When the price of a stock reaches the upper band, it may be considered overbought, suggesting a possible sell signal. Conversely, when the price reaches the lower band, it may be considered oversold, indicating a potential buy signal.
In addition to price reversals, Bollinger Bands can also be used to identify trends and support/resistance levels. If the price of a stock consistently trades above the upper band, it may indicate an upward trend. Conversely, if the price consistently trades below the lower band, it may indicate a downward trend.
Read Also: Euro USD Forecast 2023: Latest Predictions and Analysis
| Advantages: | Disadvantages: |
|---|---|
| Helps identify potential price reversals. | May generate false signals in volatile markets. |
| Provides a visual representation of volatility. | Relies on historical data and may not accurately predict future price movements. |
| Can be used to identify trends and support/resistance levels. | Does not provide any indication of the future direction of a stock’s price. |
Bollinger Bands are a popular technical analysis tool that helps traders to identify potential overbought or oversold conditions in the market. They were developed by John Bollinger in the 1980s and have since become a widely used indicator for gauging market volatility and predicting price movements.
The concept behind Bollinger Bands is based on the notion that prices tend to stay within a range most of the time, but occasionally experience periods of high volatility. Bollinger Bands consist of a center line, which is a simple moving average, and two outer bands that are based on standard deviations from the moving average.
When the market is relatively calm and the price is within the range, the bands will remain close together. However, when there is increased volatility, the bands will expand, indicating a potential price breakout.
Read Also: Discover the Most Effective Indicator to Use with Bollinger Bands
Traders can use Bollinger Bands in several ways to generate trading signals. One common strategy is to buy when the price touches the lower band and sell when it touches the upper band. Another approach is to look for periods of consolidation when the bands narrow and then enter a trade when the price breaks out of the range.
Bollinger Bands can also be used in combination with other technical indicators to confirm or filter trading signals. For example, traders may use Bollinger Bands alongside oscillators like the Relative Strength Index (RSI) to identify potential buying or selling opportunities.
Overall, Bollinger Bands provide traders with a visual representation of market volatility and can help them make more informed trading decisions. By understanding how to interpret and use Bollinger Bands effectively, traders can develop strategies that capitalize on market trends and improve their overall trading performance.
Bollinger Bands are a technical analysis tool created by John Bollinger that consists of a centerline and two price channels plotted above and below it. They are used in stock trading to identify overbought and oversold levels, as well as to determine the volatility and potential price reversals of a stock.
The width of the Bollinger Bands is significant because it reflects the volatility of the stock. When the bands are wider, it indicates higher volatility, while narrower bands suggest lower volatility. Traders can use this information to determine potential trading opportunities or to gauge the risk associated with a particular stock.

Bollinger Bands can be used to identify potential buy signals when the price touches or crosses below the lower band, and potential sell signals when the price touches or crosses above the upper band. These indicators of price extremes can suggest that a stock is oversold or overbought, respectively, and may indicate a trend reversal or a potential trading opportunity.
Combining Bollinger Bands with other technical indicators can provide more reliable trading signals. For example, using Bollinger Bands in conjunction with the Relative Strength Index (RSI) can help confirm overbought or oversold conditions. Similarly, combining Bollinger Bands with moving averages or trendlines can provide additional confirmation of potential price reversals.
Bollinger Bands can be used in both long-term and short-term trading strategies. In long-term trading, they can help identify trends and potential price reversals over a longer time horizon. In short-term trading, they can be used to identify overbought and oversold levels for quick trades. The time frame and trading strategy will determine how Bollinger Bands are applied.

Understanding the Meaning of TND Currency The TND currency, also known as the Tunisian Dinar, is the official currency of Tunisia. It holds great …
Read Article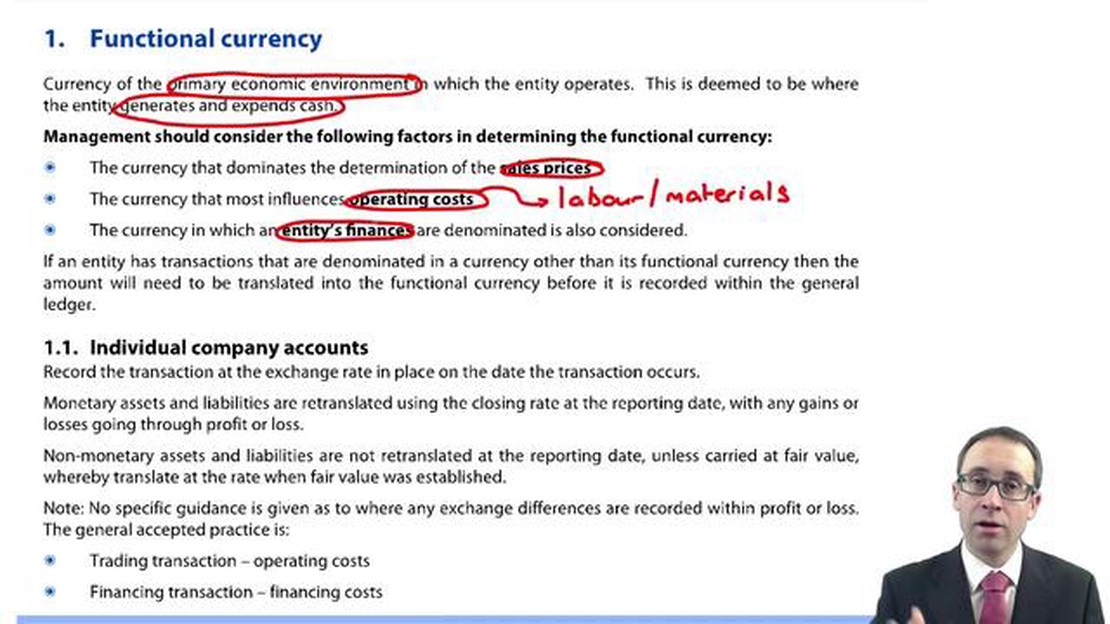
Understanding the distinction between functional currency and foreign currency When operating in a global business environment, it is crucial to …
Read Article
Should You Pay for Trading Signals? In the world of trading, one of the biggest challenges is knowing when to buy and sell. This is where trading …
Read Article
Is it possible to withdraw money from QDRO without penalty? Qualified Domestic Relations Orders (QDROs) are legal orders used to divide retirement …
Read Article
How to Start Trading Binary Options Binary options trading is a popular and accessible form of financial trading that offers potential high returns on …
Read Article
How to locate and install your WiFi driver WiFi drivers are software programs that allow your computer to connect to and communicate with wireless …
Read Article


