

Understanding SNR in Trading: What Does SNR Stand For?
What Does SNR Stand for in Trading? When it comes to trading, there are many terms and acronyms that traders need to be familiar with. One such …
Read Article
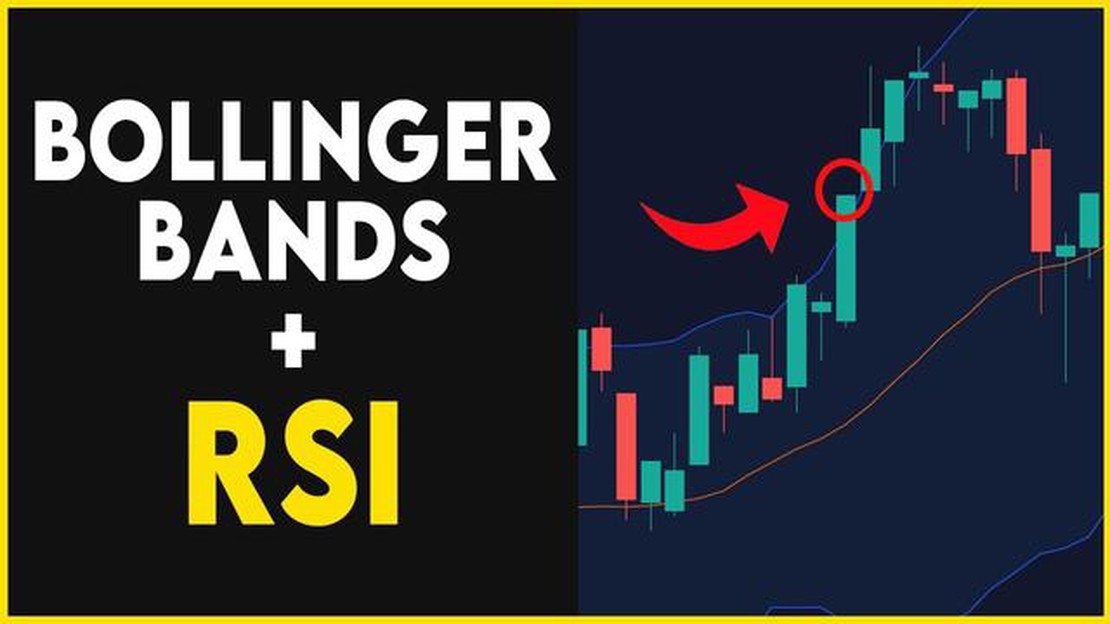
Bollinger Bands are a popular technical analysis tool used to assess market volatility and identify potential price reversals. Developed by John Bollinger in the 1980s, Bollinger Bands consist of a simple moving average line with an upper and lower band that represents two standard deviations from the average.
While Bollinger Bands are effective on their own, combining them with other technical indicators can provide further insights into market trends and potential trading opportunities. One of the most commonly used indicators with Bollinger Bands is the Relative Strength Index (RSI).
The RSI is a momentum oscillator that measures the speed and change of price movements. It ranges from 0 to 100 and is typically used to identify overbought and oversold conditions in the market. When the RSI is above 70, it is considered overbought, indicating a potential reversal may occur. Conversely, when the RSI is below 30, it is considered oversold, suggesting a potential upward reversal may take place.
When used in combination with Bollinger Bands, the RSI can help confirm potential trend reversals. For example, if the price of an asset is touching or breaking through the upper band while the RSI is above 70, it may indicate that the asset is overbought and due for a correction. Similarly, if the price is touching or breaking through the lower band while the RSI is below 30, it may suggest that the asset is oversold and a potential upward reversal may occur. This combination of indicators can help traders make more informed trading decisions.
It’s important to note that no single indicator can accurately predict future price movements, and it is always recommended to use multiple indicators and technical analysis tools to gain a comprehensive understanding of market conditions.
In conclusion, Bollinger Bands are a powerful tool for assessing market volatility, and when combined with the Relative Strength Index (RSI), they can provide valuable insights into potential trend reversals. By using these indicators together, traders can make more informed decisions and increase their chances of success in the market. Remember to always conduct thorough analysis and consider multiple indicators before making any trading decisions.

When it comes to trading in the financial markets, having the right combination of indicators can greatly improve your chances of success. Indicators are tools used by traders to analyze price data and identify potential trading opportunities. While there is no one-size-fits-all combination that guarantees success, finding the right mix of indicators for your trading style and goals is crucial.
One popular indicator that many traders use in their analysis is Bollinger Bands. Bollinger Bands are a technical analysis tool that consists of a moving average line and two standard deviation bands. They are used to measure volatility and identify overbought and oversold conditions in the market.
While Bollinger Bands can be effective on their own, combining them with other indicators can provide even more valuable insights. There are many different indicators that can be used in combination with Bollinger Bands, and it’s important to choose ones that complement each other and provide confirmation of potential trading signals.
Read Also: Iran Currency: Discover what currency Iran trades in
One common combination is to use Bollinger Bands with the Relative Strength Index (RSI). The RSI is a momentum oscillator that measures the strength and speed of price movements. When the RSI is above 70, it indicates that the market may be overbought and due for a reversal. Conversely, when the RSI is below 30, it suggests that the market may be oversold and due for a bounce.
Another useful indicator to combine with Bollinger Bands is the Moving Average Convergence Divergence (MACD). The MACD is a trend-following momentum indicator that shows the relationship between two moving averages of a security’s price. When the MACD line crosses above the signal line, it generates a bullish signal, indicating that it may be a good time to buy. On the other hand, when the MACD line crosses below the signal line, it generates a bearish signal, indicating that it may be a good time to sell.
It’s important to note that while these combinations of indicators can be powerful tools for trading success, they should not be relied upon blindly. It’s always important to conduct thorough analysis and consider other factors such as market conditions, news events, and risk management strategies when making trading decisions.
In conclusion, finding the perfect combination of indicators for optimal trading success is a personal and individual process. Experimenting with different combinations and adjusting them based on your own trading style and goals is key. By combining Bollinger Bands with other indicators such as the RSI or MACD, you can gain valuable insights and increase your chances of making profitable trades in the financial markets.
If you are a trader who uses Bollinger Bands as part of your strategy, you know the importance of having a reliable indicator to confirm your trading signals. While Bollinger Bands can be effective in identifying overbought and oversold conditions, combining them with a powerful indicator can significantly enhance your trading opportunities.
One such indicator that complements Bollinger Bands well is the Relative Strength Index (RSI). The RSI is a momentum oscillator that measures the speed and change of price movements. It ranges from 0 to 100 and is often used to identify overbought and oversold conditions.
Read Also: Understanding the Binary Option MT5 Indicator: A Comprehensive Guide
When used alongside Bollinger Bands, the RSI can help confirm potential trend reversals or continuations. For example, if the price is touching the upper Bollinger Band and the RSI is above 70, it could be a signal that the price is overbought and due for a reversal. Conversely, if the price is touching the lower Bollinger Band and the RSI is below 30, it could be a signal that the price is oversold and due for a rebound.
By combining Bollinger Bands with the RSI, you can have a more comprehensive understanding of market conditions and make more informed trading decisions. It can help filter out false signals and increase the accuracy of your trades.
It’s important to note that no single indicator is foolproof, and it’s always a good idea to use multiple indicators and analysis techniques to confirm your trading signals.

In conclusion, if you want to enhance your Bollinger Bands strategy, consider incorporating the Relative Strength Index as a powerful indicator. Its ability to identify overbought and oversold conditions can provide valuable confirmation for your trading signals. Remember to always practice proper risk management and utilize other indicators for a well-rounded trading approach.
Bollinger Bands are a technical analysis tool that consist of a simple moving average (SMA) and two standard deviation bands above and below it. The bands expand and contract based on the volatility of the price.
Bollinger Bands help in trading by indicating potential price reversals, overbought or oversold conditions, and volatility expansion or contraction. Traders can use the bands to identify entry and exit points for trades.
The most effective indicator to use with Bollinger Bands is the Relative Strength Index (RSI). RSI is a momentum oscillator that measures the speed and change of price movements. It can help identify overbought or oversold conditions when used in conjunction with Bollinger Bands.
Yes, there are several other indicators that work well with Bollinger Bands. Some popular indicators include the Moving Average Convergence Divergence (MACD), the Stochastic Oscillator, and the Average True Range (ATR). These indicators can provide additional confirmation signals when used alongside Bollinger Bands.

What Does SNR Stand for in Trading? When it comes to trading, there are many terms and acronyms that traders need to be familiar with. One such …
Read Article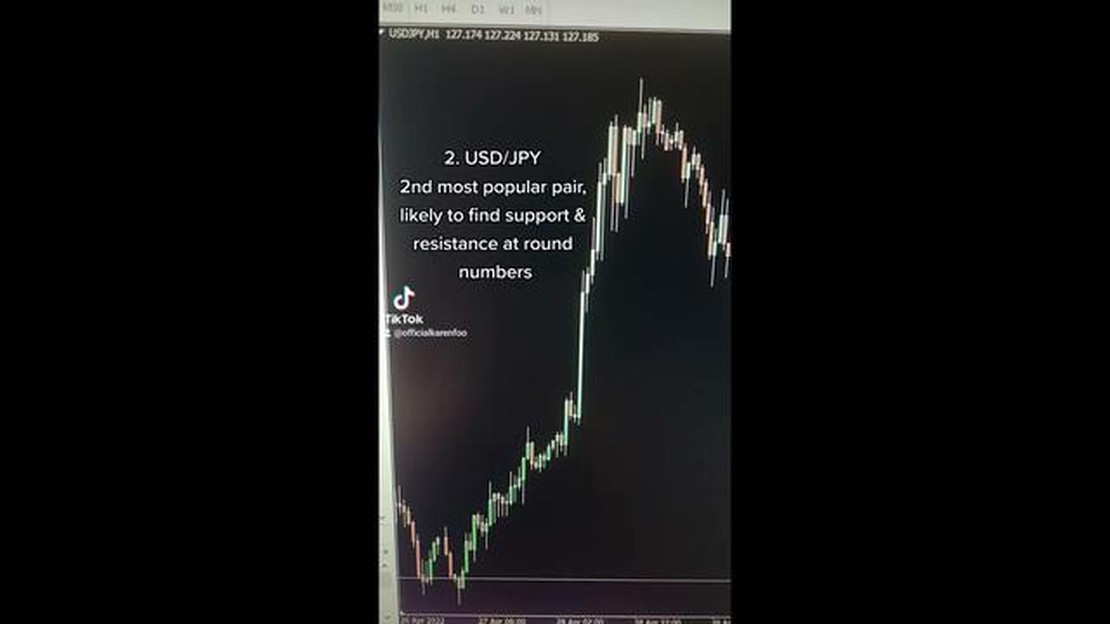
The Most Volatile Forex Pairs: Discovering the High-Risk Currency Combos When it comes to forex trading, volatility is a key factor that can greatly …
Read Article
The Origin of Forex Trading in South Africa Forex trading, or the foreign exchange market, has a long and fascinating history in South Africa. The …
Read Article
Understanding Binary and Forex Options: A Beginner’s Guide When it comes to investing, there are several options available in the market. Two popular …
Read Article
What Happens to Vested Stock Options When You Leave? Stock options can be a valuable perk of employment, offering employees the opportunity to own a …
Read Article
Forex Brokers Offering Indices Trading Trading in the forex market can be an incredibly lucrative venture, but finding the right broker to meet your …
Read Article


