

Is There a Dom for Forex Trading? Discover the Pros and Cons
Is there a dom for forex trading? Forex trading, also known as foreign exchange trading, is the buying and selling of currencies on the global market. …
Read Article
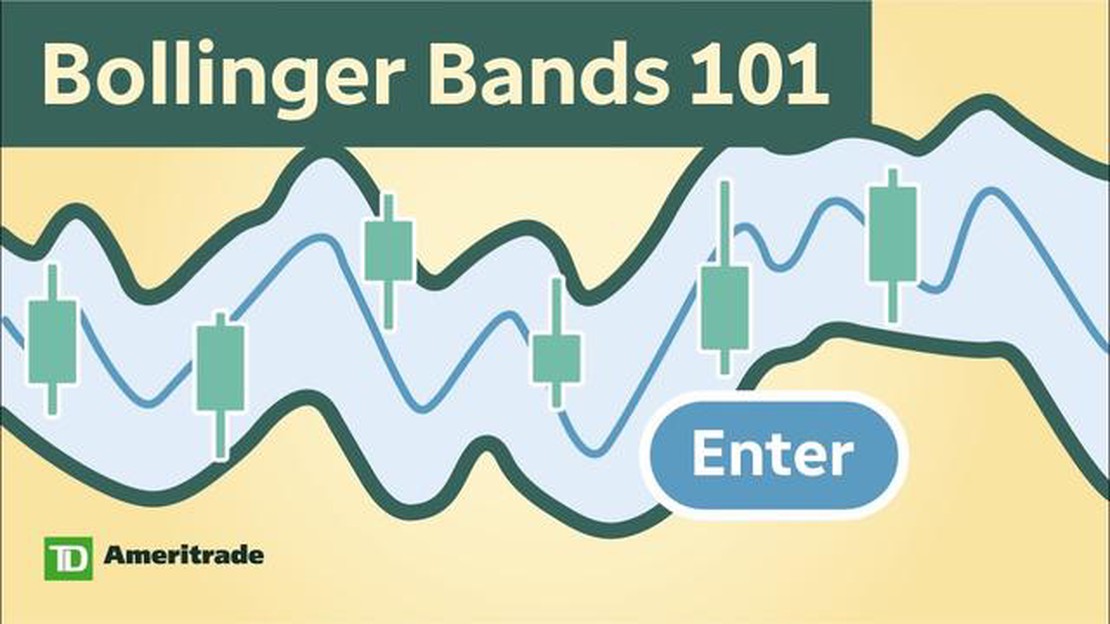
Welcome to our comprehensive guide on understanding the Bollinger Bands theory! Whether you’re a beginner in the world of trading or an experienced investor, Bollinger Bands can be a valuable tool in your arsenal. Developed by John Bollinger in the 1980s, Bollinger Bands are widely used by traders to identify potential price trends and assess market volatility.
So, what exactly are Bollinger Bands? Bollinger Bands consist of a moving average, typically set at 20 periods, and two standard deviation lines. The moving average line represents the average price over a specific time period, while the standard deviation lines show the volatility of the price movements. The width of the bands is determined by the standard deviation, which adjusts to market conditions. This means that during periods of high volatility, the bands will widen, and during periods of low volatility, the bands will narrow.
Traders use Bollinger Bands to identify potential buy and sell signals. When the price is touching or crossing the upper band, it is considered overbought, indicating a potential sell signal. On the other hand, when the price is touching or crossing the lower band, it is considered oversold, indicating a potential buy signal. However, it’s important to note that Bollinger Bands should not be used in isolation, but rather in combination with other technical analysis tools to confirm trading signals.
In this comprehensive guide, we will dive deeper into the different strategies and techniques to effectively use Bollinger Bands in your trading. We will explore how to interpret Bollinger Bands, how to identify trend reversals, how to use Bollinger Bands alongside other indicators, and much more. By the end of this guide, you’ll have a solid understanding of the Bollinger Bands theory and be able to incorporate it into your trading routine with confidence. Let’s get started!
Bollinger Bands are a technical analysis tool that consists of a moving average line and two standard deviation lines, which form a channel around the moving average line. The purpose of Bollinger Bands is to provide traders with a visual representation of volatility and potential price targets.
The moving average line in Bollinger Bands is typically a 20-day simple moving average (SMA), although this can be adjusted to suit the trader’s preferences. The upper and lower standard deviation lines are positioned two standard deviations above and below the moving average line.
When the price touches or moves outside the upper or lower standard deviation lines, it is considered a potential signal for a reversal in price direction. Prices moving outside the upper band may be overbought, while prices moving outside the lower band may be oversold.

Further analysis using Bollinger Bands involves looking for periods of low volatility followed by periods of high volatility. This can be indicated by the bands narrowing as price consolidates, followed by a breakout where the bands widen. Traders often look for opportunities to enter or exit positions during these breakout periods.
Bollinger Bands can also be used in conjunction with other technical indicators to confirm trading signals. For example, a trader may use Bollinger Bands in combination with a momentum oscillator, such as the Relative Strength Index (RSI), to identify potential buy or sell signals.
Read Also: The Structure of the Forex Market: Everything You Need to Know
It is important to note that Bollinger Bands are not meant to be used in isolation, but rather as part of a comprehensive trading strategy. Like any technical analysis tool, Bollinger Bands have limitations and are best used in conjunction with other indicators and risk management techniques.
Bollinger Bands are a technical analysis tool developed by John Bollinger in the 1980s. They consist of a simple moving average (SMA) line and two standard deviation channels, one above and one below the SMA line. The SMA line represents the average price over a specified period of time, while the standard deviation channels measure the volatility and potential price range.
The concept behind Bollinger Bands is to provide a relative definition of high and low prices. The bands widen during periods of high volatility and narrow during periods of low volatility. As the price approaches the upper band, it is considered overbought, and as it approaches the lower band, it is considered oversold.
When the price moves outside of the bands, it suggests a potential trend reversal or continuation. A breakout above the upper band indicates a bullish signal, while a breakout below the lower band indicates a bearish signal. Traders often use Bollinger Bands in combination with other technical indicators to confirm signals and make more informed trading decisions.
Additionally, Bollinger Bands can also be used to identify periods of consolidation or squeeze. When the bands narrow, it suggests that the market is in a period of low volatility and a breakout is imminent. Traders can use this information to anticipate potential price movements and position themselves accordingly.
It’s important to note that Bollinger Bands are not a standalone trading strategy but rather a tool to assist in analyzing price volatility and potential reversals. They should be used in conjunction with other technical indicators and fundamental analysis to increase the probability of successful trades.
In summary, Bollinger Bands are a popular technical analysis tool that helps traders identify price volatility and potential trend reversals. By measuring the standard deviation of price movements, they provide upper and lower channels that can be used to gauge overbought and oversold conditions. Traders can use Bollinger Bands to make more informed trading decisions and improve their overall trading strategy.
Bollinger Bands consist of three main components that work together to create the upper and lower bands. These components include:
Read Also: Can You Buy and Sell Options Daily? | A Guide to Daily Option Trading
The distance between the upper and lower bands is known as the bandwidth, which can provide insight into the volatility and potential trading opportunities. When the price is at the upper band, it may indicate overbought conditions, while being at the lower band can suggest oversold conditions.
Bollinger Bands are widely used by traders and investors to analyze price movements and identify potential trend reversals or breakouts. By understanding the components of Bollinger Bands and how they are calculated, traders can incorporate this technical indicator into their trading strategies to improve their decision-making process and potentially increase their profitability.

The main principle of the Bollinger Bands theory is that market prices tend to stay within the upper and lower boundaries of the bands. These boundaries are calculated using a moving average and standard deviation.
The Bollinger Bands are calculated using a 20-day moving average as the basis, with the upper band being two standard deviations above the moving average, and the lower band being two standard deviations below the moving average.
When the price is touching the upper Bollinger Band, it suggests that the security is overbought and could potentially be due for a price correction or reversal.
Yes, the Bollinger Bands can be used for different timeframes, such as daily, weekly, or monthly. The choice of timeframe depends on the trader’s trading style and preferences.
The Bollinger Bands can be used in conjunction with other technical indicators to confirm or filter trading signals. For example, traders may look for a price breakout above the upper Bollinger Band along with bullish signals from other indicators to enter a long trade.

Is there a dom for forex trading? Forex trading, also known as foreign exchange trading, is the buying and selling of currencies on the global market. …
Read Article
Is Forex Trading Legal in Cyprus? Forex trading has become increasingly popular in recent years, with many individuals looking to take advantage of …
Read Article
Are FedEx Employees Eligible for Stock Options? Employee stock options are a common form of compensation that many companies offer to their employees. …
Read Article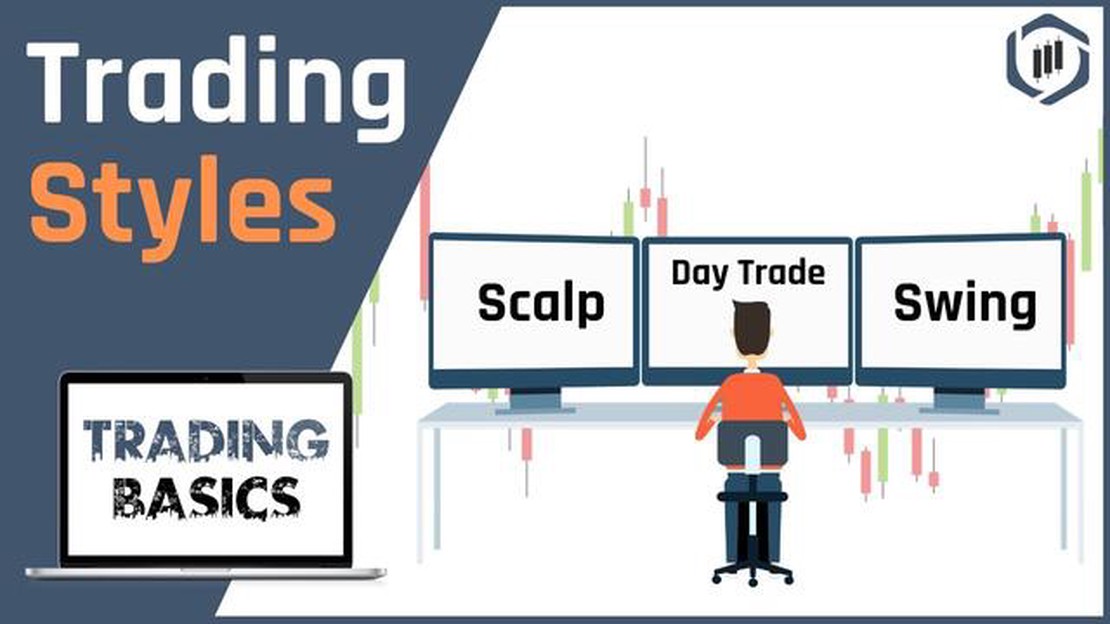
Understanding Different Forex Trading Styles Forex trading is a popular investment opportunity that allows individuals to trade currencies on the …
Read Article
Understanding the Risk Reversal and Butterfly Formula When it comes to investing in the financial markets, there are various strategies that traders …
Read Article
Understanding Dilution from Employee Stock Option Plans When it comes to managing equity, employee stock option plans (ESOPs) play a significant role. …
Read Article


