


5 Tips to Master NIFTY and Ace Your Trading Game!
Mastering NIFTY: Tips and Strategies for Success Trading in the stock market can be a daunting task, especially if you’re new to it. But with the …
Read Article
Excel is a powerful tool for data analysis, and one of its useful functions is calculating a moving average. A moving average is commonly used in finance, stock analysis, and other fields to smooth out fluctuations in data. In this step-by-step guide, we will show you how to calculate a 7-day moving average in Excel.
The first step is to organize your data in Excel. Create a column with the dates or time periods and another column with the corresponding values you want to calculate the moving average for. Make sure your data is properly sorted in ascending order based on the dates or time periods.
To calculate the 7-day moving average, we will use the AVERAGE function combined with the OFFSET function. The OFFSET function allows us to dynamically select a range of cells for the moving average calculation based on the current row position.
Here is the formula you can use to calculate the 7-day moving average in Excel:
=AVERAGE(OFFSET($B2,-6,0,7,1))
In this formula, $B2 represents the cell containing the value you want to calculate the moving average for. The -6 argument in the OFFSET function represents the number of rows to offset to select the range for the moving average calculation. The 7 argument represents the number of cells to include in the average calculation, which corresponds to the 7-day period.
Drag this formula down to calculate the moving average for the rest of your data, and you will have a column with the 7-day moving average values. You can then format the cells as needed and further analyze your data.
Calculating a 7-day moving average in Excel is a simple yet powerful way to analyze trends and patterns in your data. By following this step-by-step guide, you can easily calculate the moving average and gain valuable insights from your data.
A moving average is a statistical calculation used to analyze data over a certain period of time. It is commonly used in finance, economics, and data analysis to identify trends and smooth out fluctuations in data. The moving average is calculated by taking the average of a set of data points over a specified time period and updating it as new data becomes available.
The moving average is often used to reveal underlying patterns or remove noise from a data set. By calculating a moving average, you can see the overall trend of the data and assess whether it is increasing, decreasing, or remaining relatively stable.
There are different types of moving averages, including simple moving averages (SMA), exponential moving averages (EMA), weighted moving averages (WMA), and more. Each type of moving average applies a different weight to data points based on their position in the time series.
Traders and investors use moving averages to generate buy and sell signals, with the crossover of different moving averages indicating potential changes in the price trend. Moving averages are also commonly used in technical analysis to identify support and resistance levels, as well as to define entry and exit points for trades.

In Excel, calculating and graphing a moving average can be done by using the AVERAGE function in combination with the OFFSET or INDEX functions. By using these functions, you can easily calculate and analyze moving averages for any time period you choose.
Overall, the moving average is a valuable tool for analyzing and interpreting data trends. It helps to identify patterns, smooth out fluctuations, and make informed decisions based on historical data.
A moving average is a commonly used statistical calculation that helps smooth out data and identify trends over a specific period of time. In Excel, you can easily calculate a 7-day moving average using a simple formula and a few steps.
Read Also: Understanding Deferred Ordinary Shares: Everything You Need to Know
Here’s how you can calculate a 7-day moving average in Excel:
For example, if your data set spans from cell A2 to A100, you would enter the formula “=AVERAGE(A2:A8)” in cell B8 and drag it down to cell B100.
By calculating a 7-day moving average, you can smooth out any random fluctuations in your data and more easily identify long-term trends. This can be particularly helpful in financial analysis, stock market forecasting, and other industries where data patterns are important.
Excel provides a powerful and flexible platform for data analysis, and the ability to calculate moving averages is one of its many useful features. By following these simple steps, you can easily calculate a 7-day moving average in Excel and gain valuable insight into your data.
Calculating a 7-day moving average in Excel can be a useful tool for analyzing trends over time. This moving average smoothes out fluctuations in data and provides a clearer picture of the overall trend. Here are some tips and tricks to help you calculate a 7-day moving average in Excel:
1. Create a table: Start by creating a table in Excel with your data. Make sure you have a column for the dates and a column for the values you want to calculate the moving average for.
Read Also: Are There Any Providers of Metal Debit Cards? Find Out Here!
2. Sort your data: It is important to sort your data by date in ascending order before calculating the moving average. This ensures that the average is calculated based on the correct sequence of data points.
3. Use the AVERAGE function: The AVERAGE function is the key to calculating a moving average in Excel. To calculate a 7-day moving average, you need to select a cell where you want the average to appear and use the formula “=AVERAGE(range)”. The range should include the previous seven rows of data.
4. Drag the formula: After entering the formula for the first cell, you can drag it down to fill the rest of the column. Excel will automatically adjust the range for each cell, so you don’t have to manually update the formula for each row.

5. Format the average: To make the moving average easier to read, you can format the cell with the average to display a specific number of decimal places. Right-click on the cell, select “Format Cells,” and choose the desired number format.
6. Customize the interval: If you want to calculate a moving average for a different time period, such as a 30-day or 90-day average, you can simply adjust the range in the formula. Just make sure the range includes the desired number of rows.
7. Use conditional formatting: To highlight trends or patterns in your data, you can use conditional formatting. This feature allows you to apply formatting styles to cells based on their values. For example, you can set up conditional formatting to highlight cells with a moving average above a certain threshold.
By following these tips and tricks, you can easily calculate a 7-day moving average in Excel and gain valuable insights from your data. Whether you are analyzing sales figures, stock prices, or any other time-based data, the moving average can help you identify trends and make informed decisions.
A 7-day moving average is a calculation that helps smooth out fluctuations in data by taking the average of the past 7 days’ values. It provides a clearer picture of trends over time.
Calculating a 7-day moving average in Excel can be useful when analyzing data that has daily fluctuations. It helps identify trends and patterns over a longer period of time, making it easier to spot any underlying patterns or changes.
To calculate a 7-day moving average in Excel, you need to follow a few steps. First, organize your data in a column. Then, in an adjacent column, use the AVERAGE function to calculate the average of the first 7 values. Drag the formula down to calculate subsequent averages. Repeat the process for the rest of the data.
Yes, you can customize the number of days for the moving average calculation in Excel. Instead of using the AVERAGE function for 7 values, you can modify the function to calculate the average of a different number of values, such as 5 or 10.
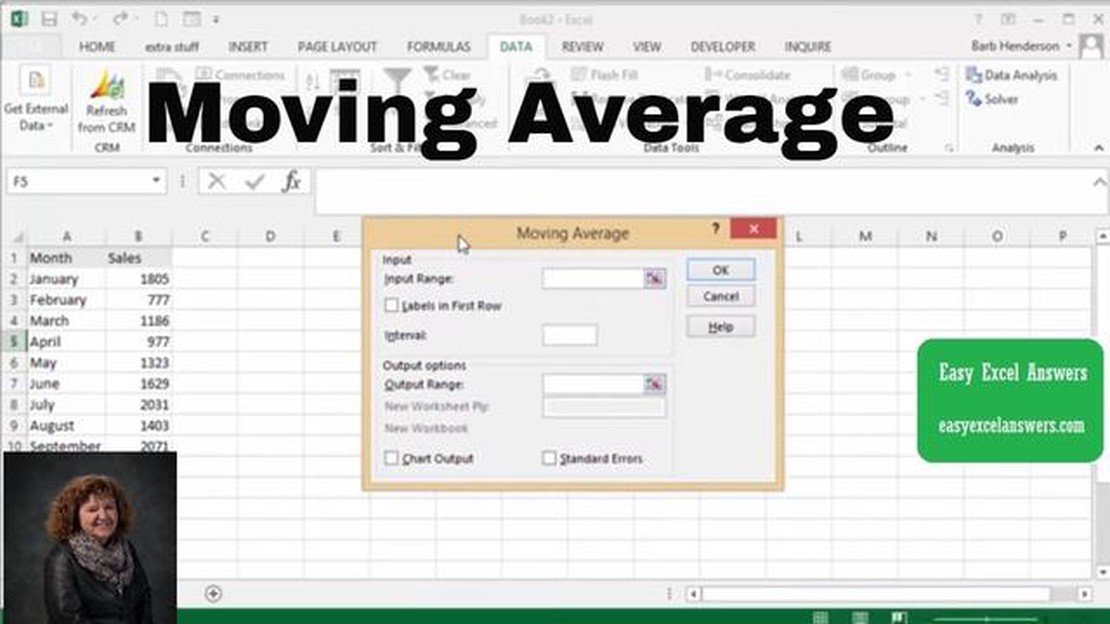
Yes, there are alternative methods to calculate a moving average in Excel. One alternative method is to use the Data Analysis Toolpak add-in, which provides more advanced statistical analysis tools, including moving averages. Another method is to use a combination of functions, such as SUM and COUNT, to calculate the average manually.
A 7-day moving average is a calculation that helps to smooth out fluctuations in data by averaging the values of the past 7 days. It is often used in finance and data analysis to identify trends and patterns over time.
To calculate a 7-day moving average in Excel, you can use the AVERAGE function combined with relative references. First, enter your data in a column. Then, in the adjacent column, use the AVERAGE function to calculate the average of the first 7 cells. Copy the formula down the column, adjusting the cell references as necessary. The result will be a 7-day moving average for each data point.

Mastering NIFTY: Tips and Strategies for Success Trading in the stock market can be a daunting task, especially if you’re new to it. But with the …
Read Article
History of Forex Market in India: When Did It Start? The foreign exchange market, also known as Forex or FX, has a long and rich history in India. The …
Read Article
How to Send Money to BCA If you need to send money to Bank Central Asia (BCA), one of the largest banks in Indonesia, it’s important to have a …
Read Article
Mastering Trading Indices: Proven Strategies for Success Trading indices is a popular and lucrative way to invest in the stock market. Indices, such …
Read Article
How to Set Up an Incentive Stock Option Plan An incentive stock option (ISO) plan is a popular tool for companies to attract and retain top talent. It …
Read Article
Are Gambling Bots Legal? In recent years, there has been a significant rise in the use of gambling bots in the online gaming industry. These automated …
Read Article


