


Understanding the Daily Spot Rate: A Comprehensive Guide
Understanding the Daily Spot Rate When it comes to international trade and finance, the daily spot rate is a crucial concept to understand. It is an …
Read Article
A moving average is a widely used statistical indicator that helps assess the trend and smooth out fluctuations in a series of data points. It is commonly used in finance, economics, and various other fields to analyze and predict trends.
The formula for calculating a moving average involves taking the sum of a specified number of data points and dividing it by the number of data points. This creates a rolling average that moves along the data series, updating with each new data point.
The formula for a simple moving average (SMA) is straightforward. It involves summing up the desired number of data points and dividing the total by the number of data points. For example, to calculate a 5-day moving average, you would sum up the closing prices of the last 5 days and divide the total by 5.
An exponential moving average (EMA) is a more complex formula that gives greater weight to recent data points. It is calculated by taking a percentage of the current data point and adding a percentage of the previous moving average. This formula provides a more responsive moving average that quickly reflects changes in the data series.
Overall, the formula for a moving average depends on the type of moving average being used. While the SMA is simpler and provides a basic average, the EMA considers the weighting of each data point, giving more importance to recent data. Both formulas are valuable tools in analyzing trends in data series.
The moving average is a popular technical analysis tool used to analyze trends over a given period of time. It is used to smooth out fluctuations and noise in data in order to identify the underlying trend. Understanding the formula for calculating the moving average is crucial in effectively using this tool.
The formula for calculating the moving average involves summing up a series of data points over a specific time period and then dividing the sum by the number of data points. This is commonly referred to as the simple moving average (SMA). The formula can be expressed as:
SMA = Sum of Data Points / Number of Data Points
In other words, to calculate the SMA, you sum up the values over a specified time period and then divide the sum by the number of data points in that period. The result is a single value that represents the average of the data points within that period.
The time period over which the moving average is calculated can vary depending on the analyst’s preference and the specific analysis being conducted. The most common time periods used are typically 10, 20, 50, or 200 days for stock market analysis, but it can also be applied to other types of data sets.
The moving average is often used to generate trading signals. By comparing the current value of an asset or security to its moving average, traders can identify potential buy or sell signals. If the current value is above the moving average, it may indicate an upward trend, while a value below the moving average may suggest a downward trend.
There are also different variations of the moving average formula, such as the weighted moving average and exponential moving average, which give more weight to recent data points. These variations allow analysts to place more emphasis on recent trends and react more quickly to changes in the data.
In conclusion, the moving average formula is a valuable tool in technical analysis for smoothing out data and identifying trends. By understanding how it works and its variations, analysts can make more informed decisions when interpreting market data.

Moving average is a statistical calculation used to analyze time series data. It is a widely used tool in technical analysis to identify trends and patterns in financial markets. Moving average smooths out the fluctuations in data, revealing the underlying trend. It is commonly used in stock market analysis, economic forecasting, and many other fields.
The moving average is calculated by taking the average of a set of data points over a specified period of time. The period can be any length, such as days, weeks, months, or even years, depending on the application. The data points are usually the closing prices of a stock, currency exchange rates, or any other time-based data series.
There are different types of moving averages, such as simple moving average (SMA) and exponential moving average (EMA). The simple moving average calculates the average of the data points equally, while the exponential moving average gives more weight to the recent data points.
Mathematically, the formula for calculating a simple moving average is:
| SMA = (X1 + X2 + X3 + … + Xn) / n |
Read Also: Using Python for Stock Trading: Pros, Cons, and Best Practices
where X1, X2, X3, …, Xn are the data points and n is the period of the moving average.
The formula for calculating an exponential moving average is more complex and involves a smoothing factor:
Read Also: Is Options Trading Really Profitable? Discover the Answers Here
| EMA = ((Xn - EMAprev) * Multiplier) + EMAprev |
where Xn is the current data point, EMAprev is the previous EMA value, and Multiplier is a weighting factor that determines the importance of the current data point.
Using moving averages, analysts can identify trends, support and resistance levels, and potential entry and exit points in financial markets. They can also generate trading signals and develop trading strategies based on moving average crossovers and divergences.
Calculating the moving average is a useful statistical technique that helps to smooth out fluctuations in data and identify trends over time. It is widely used in various fields, including finance, economics, and engineering. The moving average is a simple yet powerful tool that can provide valuable insights into patterns and behaviors.
To calculate the moving average, follow these steps:

As an example, let’s say we have the following daily stock prices for a particular company:
If we want to calculate the 3-day moving average, we would add up the prices for Day 1, Day 2, and Day 3, which gives us a sum of $37. Then, we divide this sum by 3 to get a moving average of $12.33 for that period. We repeat this process for the remaining periods, shifting the intervals forward by one day each time.
By calculating the moving average, we can smooth out the daily fluctuations in stock prices and identify the underlying trend. This can be useful for making investment decisions or analyzing market behavior.
In conclusion, the formula for calculating the moving average involves adding up the data points for a specified number of intervals and then dividing the sum by the number of intervals. This process is repeated for each subsequent period to obtain a moving average for all periods. Understanding how to calculate the moving average is essential for anyone working with time series data and seeking to identify trends and patterns.
A moving average is a statistical calculation used to analyze data points by creating a series of averages of different subsets of the full data set.
Moving average is calculated by taking the average of a specified number of data points, typically over a specific time period.
The formula for calculating a simple moving average is to sum up all the data points over a specified period and divide the sum by the number of data points.
The formula for calculating an exponential moving average is EMA = (Closing price - EMA previous day) * (2 / (n + 1)) + EMA previous day, where n is the number of periods.
Moving averages are used in technical analysis to smooth out price fluctuations and identify trends over a specified period of time. They can be used to generate buy or sell signals and provide an indication of support and resistance levels.
A moving average is a calculation used to analyze data points by creating a series of averages of different subsets of the full data set.
The formula for calculating a simple moving average is as follows: SMA = (Sum of closing prices over a given period) / (Number of periods)

Understanding the Daily Spot Rate When it comes to international trade and finance, the daily spot rate is a crucial concept to understand. It is an …
Read Article
Introduction to Guppy GMMA Strategy Are you looking for a trading strategy that has been proven to be successful time and time again? Look no further …
Read Article
Understanding the Moving Average in Management In the fast-paced world of business and management, companies are constantly seeking ways to stay ahead …
Read Article
Strategies for Volatility Based Options Trading Options trading can be a highly profitable venture, but it also carries a significant amount of risk. …
Read Article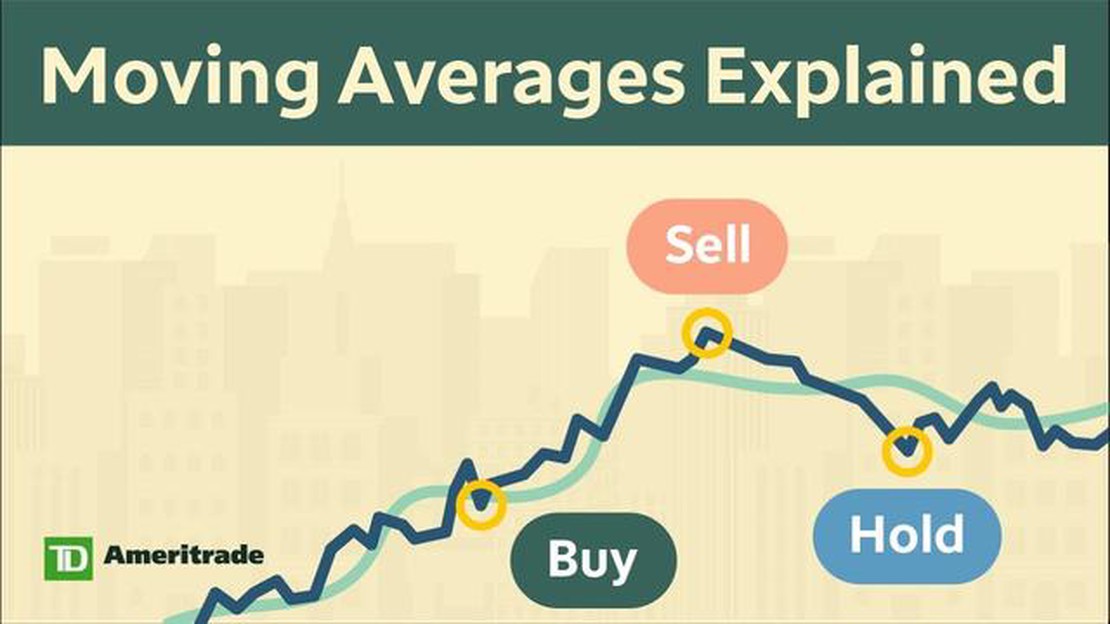
Understanding the utilization of moving averages method Moving averages is a widely used method in financial analysis that helps identify trends and …
Read Article
What is the expiry time for options trading? Options trading is a popular form of investment that allows traders to speculate on the price movement of …
Read Article


