

Are Demo Accounts Free? Discover the Benefits of Using Free Demo Trading Accounts
Are demo accounts free? In the world of finance and investing, demo accounts have become an indispensable tool for both novice and experienced …
Read Article
Moving averages is a widely used method in financial analysis that helps identify trends and predict future movements in the stock market. This technique is based on the principle that past prices can provide valuable insights into future price movements.
The moving averages method involves calculating the average price of a security over a specified period of time, such as 50 days or 200 days. By plotting these averages on a chart, analysts can observe the overall direction of the price trend and determine potential entry or exit points for trades.
There are two main types of moving averages: the simple moving average (SMA) and the exponential moving average (EMA). The SMA takes the average of a set number of periods, while the EMA gives more weight to recent prices. Both types of moving averages have their own advantages and may be used depending on the specific analysis being conducted.
To effectively use the moving averages method, analysts often employ multiple moving averages with different time periods. This is known as a moving averages crossover strategy. By looking for crossovers between different moving averages, analysts can identify potential trend reversals or confirm the strength of an existing trend.
It is important to note that moving averages are not foolproof indicators and should be used in conjunction with other technical analysis tools. Traders and investors should consider factors such as volume, support and resistance levels, and overall market conditions when making decisions based on moving averages.
Overall, the moving averages method is a powerful tool for analyzing financial markets. By understanding how to calculate and interpret moving averages, traders and investors can gain valuable insights to support their decision-making process and improve their chances of success in the market.

The moving averages method is a commonly used analytical tool in financial markets. It is used to identify trends, support and resistance levels, and potential entry and exit points for trading.
Moving averages are indicators that calculate an average price over a specified period of time and plot it on a chart. The most commonly used moving averages are the simple moving average (SMA) and the exponential moving average (EMA).
The simple moving average is calculated by adding up the closing prices of a security over a specific number of periods and dividing it by the number of periods. For example, a 10-day SMA is calculated by adding up the closing prices of the past 10 days and dividing it by 10.
Read Also: Is there a correlation between gold and silver in forex trading?
The exponential moving average, on the other hand, gives more weight to recent prices and assigns a smaller weight to older prices. This makes it more responsive to price changes in the recent past. The formula for calculating the EMA is more complex than the SMA and takes into account the previous EMA value.
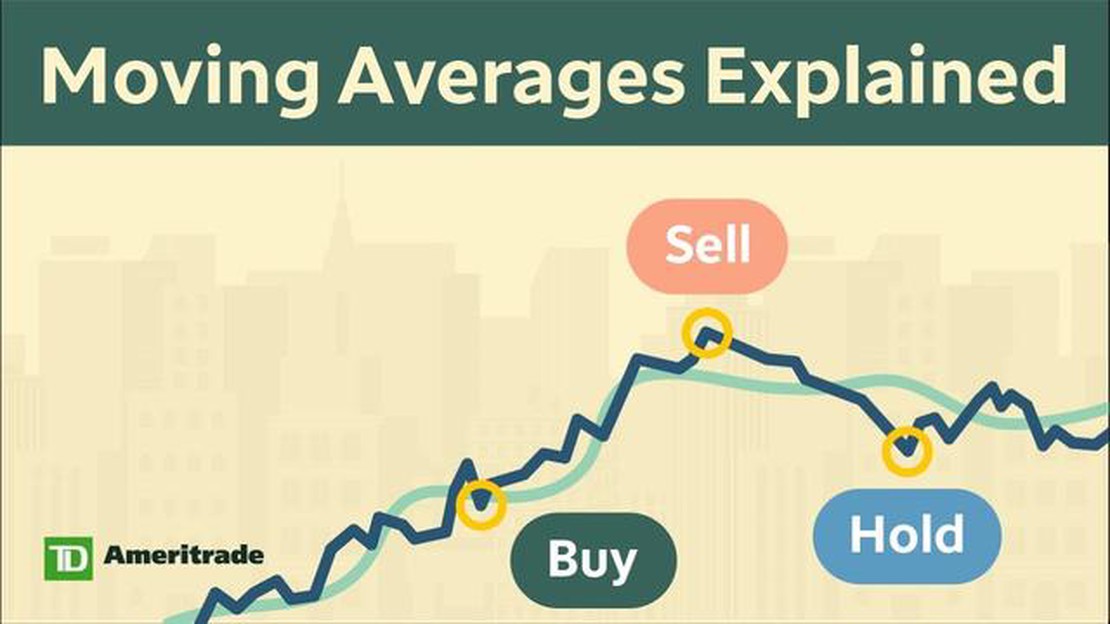
Moving averages can be used in different ways to analyze price data. One common method is to use two moving averages with different time periods, such as a short-term moving average and a long-term moving average. When the short-term moving average crosses above the long-term moving average, it is considered a bullish signal, indicating that the price may continue to rise. Conversely, when the short-term moving average crosses below the long-term moving average, it is considered a bearish signal, indicating that the price may continue to decline.
Moving averages can also be used to identify support and resistance levels. A support level is a price level at which the price has historically had difficulty falling below, while a resistance level is a price level at which the price has historically had difficulty rising above. When the price approaches a moving average from below and bounces off it, it can be considered a support level. Conversely, when the price approaches a moving average from above and bounces off it, it can be considered a resistance level.
In conclusion, the moving averages method is a versatile tool for analyzing price data in financial markets. It can help traders identify trends, support and resistance levels, and potential entry and exit points for trading.
The Moving Averages method is a popular tool used by traders and analysts for effective analysis in financial markets. This method involves calculating the average price over a specific period of time, which helps in smoothing out the price data and identifying trends.
There are several benefits of using the Moving Averages method in technical analysis:
| 1. Trend identification: | By calculating moving averages of different time frames, traders can identify the direction and strength of a trend. This helps in making informed trading decisions. |
| 2. Support and resistance levels: | Moving averages act as dynamic support and resistance levels. These levels provide important reference points for traders to enter or exit trades. |
| 3. Confirmation of signals: | Moving averages can be used to confirm trading signals generated by other technical indicators. This adds an additional layer of validation to the analysis. |
| 4. Smoothed price data: | The Moving Averages method smooths out the price data, making it easier to identify trends and patterns. This reduces the impact of market noise on the analysis. |
| 5. Versatility: | Moving averages can be used in different time frames and for different trading strategies. They can be applied to any financial instrument, making them versatile tools for analysis. |
In conclusion, the Moving Averages method provides numerous benefits for traders and analysts. It helps in trend identification, support and resistance levels, confirming signals, smoothing price data, and offers versatility in analysis. By incorporating this method into their trading strategies, traders can make more informed decisions and improve their overall performance.
Read Also: Top Big Companies Using MATLAB for their Research and Development
The moving averages method is a popular technical analysis tool used to analyze and predict future price trends. It calculates the average price of an asset over a specific time period, smoothing out short-term fluctuations to identify long-term trends.
To calculate a moving average, you add up the prices over a specific time period and then divide by the number of periods. For example, a 5-day moving average would be calculated by adding up the prices of the last 5 days and dividing by 5.
Moving averages help traders and analysts to identify trends and make informed trading decisions. They provide a smoothed representation of price data, making it easier to recognize the direction of the market and filter out noise.

There are several types of moving averages, including simple moving averages (SMA), exponential moving averages (EMA), weighted moving averages (WMA), and smoothed moving averages (SMMA). Each type has its own calculation method and characteristics.
Moving averages can be used to generate trading signals, identify support and resistance levels, and determine potential entry and exit points. Traders often look for crossovers between different moving averages or monitor the relationship between price and the moving average to make trading decisions.
The moving averages method is a technical analysis tool used by traders to identify trends and potential reversals in financial markets. It calculates the average price of an asset over a specific time period and plots it on a chart.
You can use the moving averages method for analysis by looking for crossovers between different moving averages. For example, a bullish signal is generated when a shorter-term moving average crosses above a longer-term moving average, indicating a potential uptrend. Conversely, a bearish signal is generated when a shorter-term moving average crosses below a longer-term moving average, indicating a potential downtrend.

Are demo accounts free? In the world of finance and investing, demo accounts have become an indispensable tool for both novice and experienced …
Read Article
Get FX Alerts: A Comprehensive Guide to Receiving Forex Alerts In today’s fast-paced global economy, staying informed about currency trends and …
Read Article
Rolling Capital Gains from Stocks into Real Estate: Is it Possible? Investing in stocks can be highly profitable, but it also comes with hefty tax …
Read Article
What is Genesis trading? Genesis Trading is a well-established cryptocurrency trading firm that has gained a reputation for its expertise and …
Read Article
How to Sell Call Options: A Comprehensive Strategy Guide Call options are a popular financial instrument used by investors to generate income and …
Read Article
The Benefits of Forex Services When it comes to managing your financial transactions, using forex services can offer a range of benefits over …
Read Article


