


What caused the decline of Alcatel Lucent shares in the market?
What happened to Alcatel Lucent shares? The decline of Alcatel Lucent shares in the market can be attributed to several factors that have affected the …
Read Article
Support and resistance (S&R) are two key concepts in trading that help traders determine potential price levels at which the market is likely to reverse or consolidate. These levels are crucial for understanding market psychology and making informed trading decisions.
Support is a price level at which demand for a security or asset is strong enough to prevent further price declines. It acts as a floor and provides buying pressure, as traders believe the price is undervalued and start buying, thereby creating demand and support. When the price reaches this level, it tends to bounce back up.
Resistance, on the other hand, is a price level at which selling pressure is strong enough to prevent the price from rising further. It acts as a ceiling and provides selling pressure, as traders believe the price is overvalued and start selling, thereby creating supply and resistance. When the price reaches this level, it tends to bounce back down.
Support and resistance levels can be identified through various technical analysis tools, such as trendlines, moving averages, or chart patterns. Traders often use these levels to set entry points, stop-loss orders, and target prices. By understanding where support and resistance levels are, traders can potentially increase their chances of making profitable trades.
It is important to note that support and resistance levels are not always exact price points, but rather zones or areas where price action tends to slow down or reverse. This is because trading is a dynamic process influenced by various factors, such as market sentiment and liquidity.
To summarize, support and resistance levels are essential aspects of trading as they provide valuable insights into market behavior and help traders anticipate potential price movements. By identifying and analyzing these levels, traders can make more informed decisions, manage risk, and potentially improve their trading results. It is crucial for beginners to understand the significance of support and resistance levels and incorporate them into their trading strategies.
When it comes to trading, understanding support (S) and resistance (R) levels is essential. These levels represent psychological price levels in the market, where buying and selling pressure are likely to occur.
Support level (S) refers to a price level where buying pressure is strong enough to prevent the price from falling further. It acts as a floor that supports the price from declining. Traders often buy when the price reaches a support level, anticipating a bounce or a reversal in the market.
Resistance level (R), on the other hand, refers to a price level where selling pressure is strong enough to prevent the price from rising further. It acts as a ceiling that prevents the price from breaking higher. Traders often sell when the price reaches a resistance level, anticipating a pullback or a reversal in the market.
These support and resistance levels are not fixed, but rather dynamic levels that are constantly changing based on market conditions. They are formed by previous price action, where significant buying or selling occurred. Traders use various technical analysis tools and indicators to identify these levels on price charts.
Support and resistance levels are important because they provide traders with key areas to enter and exit trades. Traders can use these levels to set stop-loss and take-profit orders, manage their risk, and make informed trading decisions.

It’s important to note that support and resistance levels are not guaranteed to hold forever. They can be broken and reversed as market conditions change. Therefore, it’s essential for traders to constantly monitor and adjust their strategies based on current market conditions.
In conclusion, understanding support and resistance levels is crucial for successful trading. These levels indicate areas of buying and selling pressure in the market and can be used to make informed trading decisions. Traders should use various technical analysis tools to identify and monitor these levels, and continuously adapt their strategies based on market conditions.
Read Also: Where to Download Historical FX Rates: Best Sources and Websites
In trading, support and resistance levels are key price levels at which a financial instrument, such as a stock or a currency pair, tends to find buyers (support) or sellers (resistance).
Support level is a price level at which there is enough buying pressure to prevent the price from falling further. It acts as a “floor” for the price, as demand exceeds supply at this level. Traders and investors often look for support levels to identify potential buying opportunities or to set stop-loss levels to limit their downside risk.
Resistance level, on the other hand, is a price level at which there is enough selling pressure to prevent the price from rising further. It acts as a “ceiling” for the price, as supply exceeds demand at this level. Traders and investors often look for resistance levels to identify potential selling opportunities or to set profit-taking levels to lock in their gains.
Support and resistance levels are not fixed or static. They can change over time as market conditions and investor sentiment evolve. They can be identified using various technical analysis tools, such as trendlines, moving averages, Fibonacci retracements, or pivot points.
Support and resistance levels can play a significant role in traders’ decision-making process. Breakouts above a resistance level or breakdowns below a support level can act as signals for potential trend reversals or continuation. Traders often use support and resistance levels in combination with other technical indicators and analysis techniques to make more informed trading decisions.
Support and resistance levels are fundamental concepts in technical analysis, used by traders to identify potential price levels at which an asset may experience a pause in its current trend or reverse its direction. These levels are determined by the historical price data of an asset, reflecting areas of buying and selling interest.
Read Also: Top Crypto Stocks to Invest in: A Comprehensive Guide
Support levels are price levels at which demand for an asset is strong enough to prevent it from declining further. Traders believe that buyers are more likely to enter the market and purchase the asset at these levels, causing the price to bounce back up. Support levels are often seen as floors for the price of an asset, a point beyond which it is expected to find support.
Resistance levels, on the other hand, are price levels at which selling pressure is strong enough to prevent an asset from rising further. Traders believe that sellers are more likely to enter the market and sell the asset at these levels, causing the price to reverse and move lower. Resistance levels are often seen as ceilings for the price of an asset, a point at which it is expected to encounter selling pressure.

Support and resistance levels can be identified using various methods, including trendlines, moving averages, and Fibonacci retracement levels. These levels are considered significant because they represent areas where traders are likely to place their buy or sell orders. When the price approaches a support level, traders may look for buying opportunities, expecting the price to rebound. Conversely, when the price approaches a resistance level, traders may look for selling opportunities, expecting the price to reverse and move lower.
Support and resistance levels can also be used to set profit targets and stop-loss levels. For example, a trader may set a profit target just below a resistance level, anticipating that the price is less likely to rise beyond that point. Similarly, a trader may set a stop-loss order just below a support level, protecting against potential losses if the price breaks through that level.
| Support | Resistance |
|---|---|
| Price levels where demand is strong and prevents further decline | Price levels where selling pressure is strong and prevents further rise |
| Considered as floors for the price | Considered as ceilings for the price |
| Traders may look for buying opportunities | Traders may look for selling opportunities |
| Used to set profit targets | Used to set profit targets |
Support and resistance levels are key concepts in technical analysis that are used to identify potential price levels where the market is likely to pause, reverse, or find strong buying or selling pressure. Support is a level where the price tends to stop falling and may start to rise, while resistance is a level where the price tends to stop rising and may start to fall.
Traders use support and resistance levels as tools to make informed trading decisions. They can use these levels to identify potential entry or exit points for trades, set stop-loss orders, and determine the risk-to-reward ratio of a trade. Support and resistance levels also help traders determine the overall trend of a market and make predictions about future price movements.
Support and resistance levels are determined by analyzing historical price data on a chart. Traders look for areas where the price has previously found support or faced resistance. These areas can be identified by horizontal lines drawn across previous price highs (resistance) or lows (support). Other technical indicators and tools, such as trendlines and moving averages, can also be used to confirm the validity of support and resistance levels.
No, support and resistance levels are often seen as zones rather than exact price points. This is because the market can fluctuate around these levels, and it is common for the price to temporarily breach a level before reversing. Traders usually give some leeway above or below the level to account for these fluctuations and avoid getting stopped out prematurely.
Yes, support levels can become resistance levels and vice versa. When the price breaks below a support level, that level can become a new resistance level if the price later attempts to rise back up. Similarly, when the price breaks above a resistance level, that level can become a new support level if the price later declines. These role reversals often occur due to changes in market sentiment or supply and demand dynamics.
Support and resistance levels are technical analysis tools used by traders to identify potential price levels at which a stock or other financial instrument may face buying or selling pressure. Support levels are price levels at which a stock has historically had difficulty falling below, indicating a level of demand for the stock. Resistance levels, on the other hand, are price levels at which a stock has historically had difficulty rising above, indicating a level of supply for the stock. These levels can help traders make decisions about when to buy or sell a particular stock.
Support and resistance levels can be identified using various technical analysis methods. One common method is to look for areas on a chart where the price has previously reversed direction multiple times. For example, if the price of a stock has consistently bounced off a certain price point and risen, that price point could be considered a support level. Resistance levels can be identified in a similar manner, by looking for areas where the price has consistently been unable to move higher.

What happened to Alcatel Lucent shares? The decline of Alcatel Lucent shares in the market can be attributed to several factors that have affected the …
Read Article
What is Moving Average in Supply Chain Management? The moving average is a statistical technique widely used in supply chain management to analyze and …
Read Article
Choosing the Best Binary Option Platform: Your Key to Online Trading Success Binary options trading has become an increasingly popular way for …
Read Article
FXCM Commission Per Lot: What You Need to Know FXCM, one of the leading online forex trading platforms, offers a wide range of services to cater to …
Read Article
Choose the Best Forex Demo Account for Your Trading Are you interested in Forex trading but not quite ready to dive into the real market? A Forex demo …
Read Article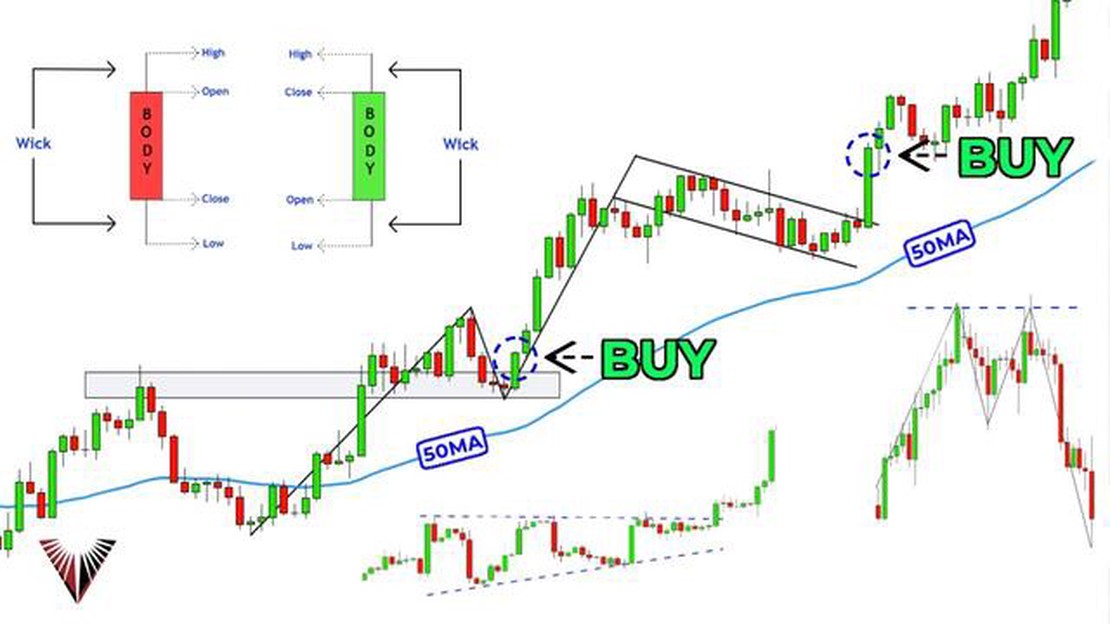
Make Money with Technical Analysis: A Comprehensive Guide Technical analysis is a popular method used by traders and investors to forecast future …
Read Article


