


Step-by-Step Guide: How to Get a Forex Demo Account
How to Open a Forex Demo Account If you are new to forex trading and want to practice without risking any real money, getting a forex demo account is …
Read Article
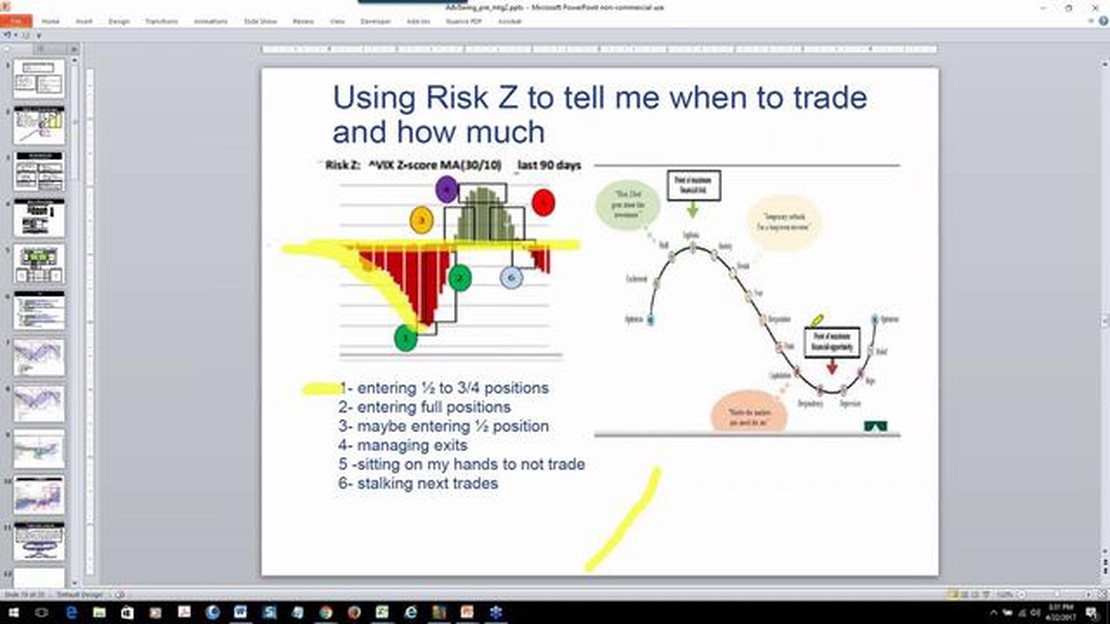
When it comes to trading in the financial markets, there are many different strategies and techniques that traders use to try to gain an edge. One such technique is z-score trading, which is based on statistical analysis and the concept of normal distribution.
Z-score trading involves measuring the deviation of a particular data point from the mean of a set of data points, and then comparing it to the standard deviation. This allows traders to identify opportunities where the price of an asset may be overbought or oversold, and potentially make profits by taking advantage of these inefficiencies.
To calculate the z-score of a data point, you first need to determine the mean and standard deviation of the data set. Subtract the mean from the data point, and then divide the result by the standard deviation. The resulting z-score tells you how many standard deviations away the data point is from the mean.
For example, if the z-score of a data point is 2, it means that the data point is 2 standard deviations above the mean. A z-score of -1 would mean that the data point is 1 standard deviation below the mean.
Once you have calculated the z-score of a data point, you can use it to determine whether the price of an asset is likely to revert to the mean or continue on its current trend. If the z-score is high, indicating that the price is overbought, you may want to consider selling the asset. Conversely, if the z-score is low, indicating that the price is oversold, you may want to consider buying the asset.

Z-score trading can be a valuable tool for traders looking to capitalize on short-term market inefficiencies. However, it is important to note that z-scores are not foolproof and should be used in conjunction with other technical analysis tools and indicators.
In conclusion, understanding z-score trading can potentially give traders an advantage in the financial markets. By analyzing the deviation of price from the mean, traders can identify potential buying or selling opportunities. However, it is important to remember that z-scores are not infallible and should be used in conjunction with other analysis techniques.
Trading in the financial markets can be a complex and challenging endeavor. With so many factors to consider, it can be difficult to determine the best course of action. One approach that traders use to assess the relative value of a security is z-score trading. In this guide, we will explore what z-score trading is and how it can be used to make more informed trading decisions.
Read Also: What Sets MT4 Expert Advisors Apart from MT5 Expert Advisors
Z-score trading is a statistical measure that quantifies the deviation of a data point from the mean in standard deviations. It is often used to determine if a security is overvalued or undervalued relative to its historical performance. A positive z-score indicates that a security is trading above its mean, while a negative z-score suggests that it is trading below its mean.
By calculating the z-score of a security, traders can assess its current value relative to past performance. This can be helpful in identifying opportunities for buying or selling. For example, if a security has a positive z-score, it may be overvalued and present a selling opportunity. Conversely, if a security has a negative z-score, it may be undervalued and present a buying opportunity.
It’s important to note that z-score trading is just one tool in a trader’s toolbox. It should be used in conjunction with other indicators and analysis techniques to make well-rounded trading decisions. Additionally, z-score trading is not foolproof and should be used with caution. Market conditions can change rapidly, and historical performance may not be indicative of future results.
When using z-score trading, it’s important to have a reliable data source that provides accurate and up-to-date information. Traders should also consider the time period over which the z-score is calculated. A longer time period may provide a more stable z-score, while a shorter time period may capture more recent market trends.
In conclusion, z-score trading is a statistical measure that can help traders assess the relative value of a security. By calculating the z-score, traders can determine if a security is overvalued or undervalued relative to its historical performance. However, it is important to use z-score trading in conjunction with other indicators and analysis techniques, and to consider market conditions and data accuracy.
Z-score trading is a powerful tool that can help traders assess the performance and risk of a trade or investment. It provides a standardized way to compare different trading strategies and identify potential opportunities for profit.
One of the key benefits of z-score trading is its ability to eliminate the influence of market volatility on trading decisions. By calculating the z-score, traders can determine whether a trade’s performance is due to skill or luck. This helps traders avoid making emotional decisions based on short-term fluctuations in the market.
Another important aspect of z-score trading is its ability to identify potential reversals in a trade. By monitoring the z-score over time, traders can recognize when a trade is deviating from its historical performance. This can signal that the trade is no longer following its expected pattern and may be susceptible to a reversal.
Read Also: What is the Mesa Adaptive Moving Average (MAMA)? | Explained Guide
In addition, z-score trading can help traders manage risk by identifying trades with a high probability of success. By analyzing the z-score distribution, traders can determine the likelihood of achieving a positive return on a trade. This information can be used to set stop-loss and take-profit levels, as well as determine position sizing.
Overall, the importance of z-score trading lies in its ability to provide objective and quantifiable measures of a trade’s performance and risk. By using z-scores, traders can make more informed decisions and improve their chances of success in the market.
A z-score is a measure of how many standard deviations an element is from the mean of a statistical data set.

The z-score is calculated by subtracting the mean of the data set from the element and dividing it by the standard deviation of the data set.
Z-score trading is a trading strategy that uses the z-score to identify and take advantage of deviations from the mean in financial markets.
Z-score trading works by identifying when the z-score of a stock or asset moves beyond a certain threshold, indicating that it is overbought or oversold. Traders can then take positions based on this information.
Z-score trading allows traders to identify potential market inefficiencies and profit from them. It also provides a systematic approach to trading that can help reduce emotional bias.

How to Open a Forex Demo Account If you are new to forex trading and want to practice without risking any real money, getting a forex demo account is …
Read Article
Understanding the IQ Option Multiplier: Everything You Need to Know IQ Option is a popular online trading platform that allows users to trade a …
Read Article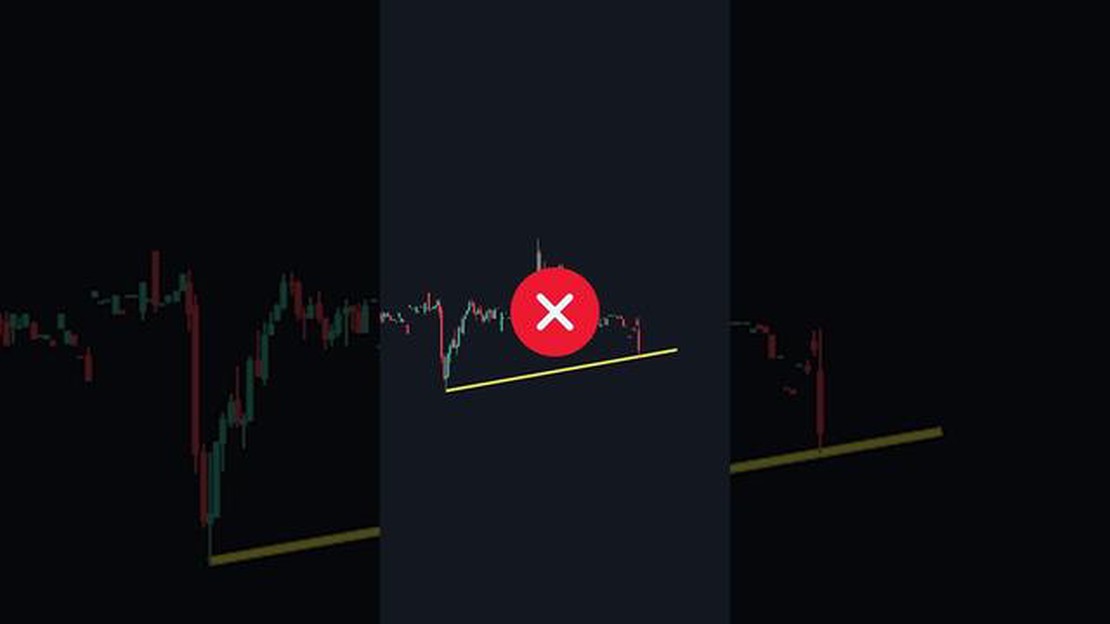
What Are the Rules for Trendlines? Drawing trendlines is an essential skill for any technical analyst or trader. Trendlines help to identify the …
Read Article
Is CFD Trading Profitable? Contracts for Difference (CFDs) trading has gained popularity in recent years as a way for investors to potentially profit …
Read Article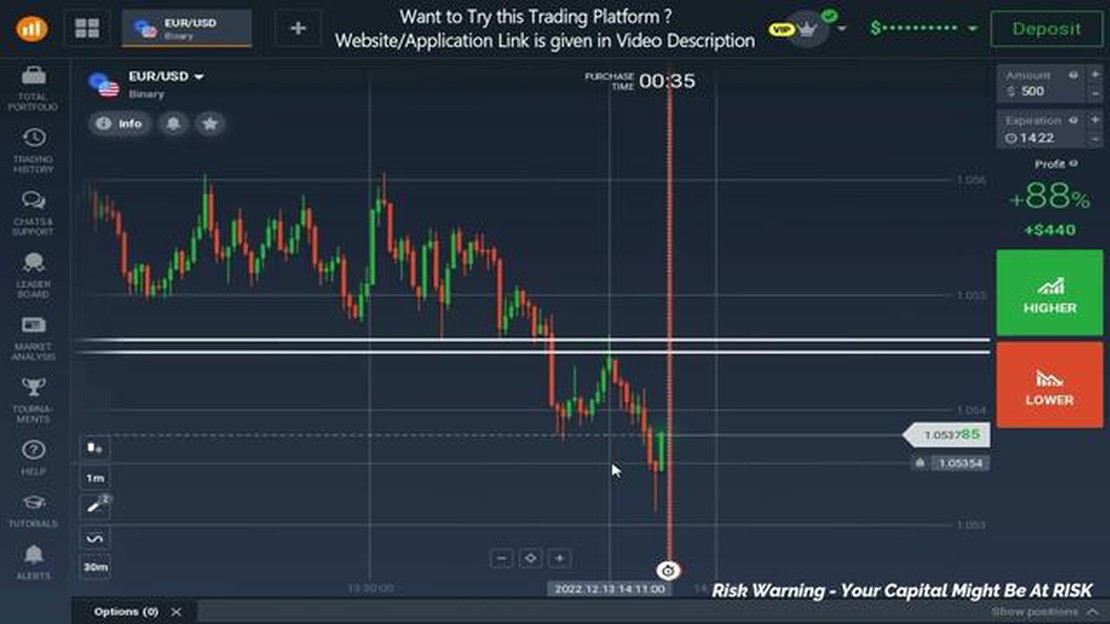
Is reversal trading profitable? Reversal trading, also known as countertrend trading, is a popular strategy among traders. Instead of following the …
Read Article
Understanding the Bullish Aspects of an Iron Condor Options Strategy Iron condor is a popular options trading strategy used by traders to profit from …
Read Article


