


Who is eligible to hold shares in an S corporation?
Eligibility to Hold Shares in an S Corporation An S corporation, also known as an S corp, is a type of business structure that provides certain tax …
Read Article
Calculating weighted moving averages in Excel can be a useful tool for analyzing data trends over time. A moving average is a statistical calculation that helps to smooth out fluctuations in data by averaging a certain number of consecutive data points. By assigning weights to each data point, a weighted moving average gives more importance to recent data points, making it a valuable tool for trend analysis.
In this step-by-step guide, we will walk you through the process of calculating weighted moving averages in Excel. We will show you how to set up your data, assign weights to each data point, and perform the calculations to obtain the weighted moving averages. Whether you are a beginner or an experienced Excel user, this guide will provide you with the necessary knowledge and skills to effectively analyze your data.
To calculate a weighted moving average in Excel, you will need a basic understanding of formulas and functions. We will demonstrate the use of the SUMPRODUCT function, which allows you to multiply each data point by its corresponding weight and sum the results. This function simplifies the calculation process and provides accurate results.
Note: Before calculating weighted moving averages, it is important to determine the appropriate weighting scheme for your data. The choice of weights depends on the importance you want to assign to each data point. Common weighting schemes include linear, exponential, and triangular.
By the end of this guide, you will be able to confidently calculate weighted moving averages in Excel and apply this knowledge to your data analysis tasks. Whether you are interested in financial analysis, sales forecasting, or any other field that requires tracking trends, understanding how to calculate weighted moving averages will greatly enhance your data analysis skills.
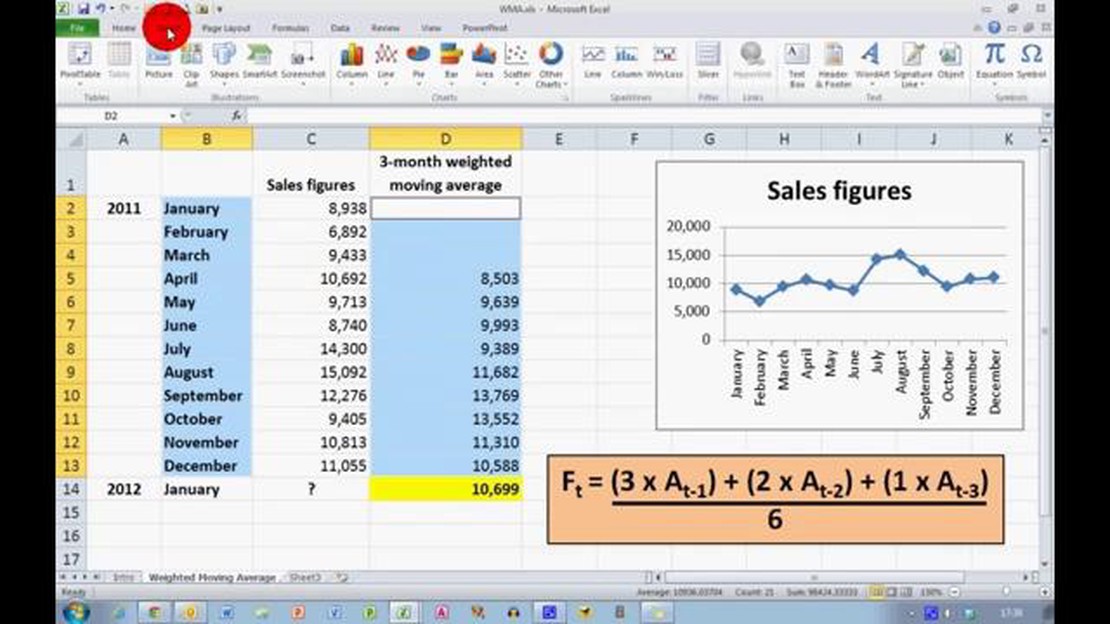
A Weighted Moving Average (WMA) is a popular method for analyzing trends in data. It assigns different weights to data points based on their chronological order, with more recent data points receiving higher weights. This allows for a more accurate representation of the current trend.
To calculate a weighted moving average in Excel, you can follow these steps:
Using these steps, you can easily calculate a weighted moving average in Excel and analyze trends in your data. This method is particularly useful in financial analysis, market research, and forecasting.
Remember to adjust the weights and number of data points to fit your specific analysis needs. Experiment with different weighting schemes to find the best fit for your data.
By calculating weighted moving averages in Excel, you can gain valuable insights into trends and make more informed decisions based on the most recent data.

A weighted moving average is a commonly used statistical tool that calculates the average of a set of values over a specific period of time, where each value is assigned a weight based on its importance or significance. This type of moving average places more emphasis on recent data points while giving less weight to older data points.
Weighted moving averages are often used in financial analysis and forecasting to smooth out fluctuations in data and identify trends or patterns. By assigning different weights to each data point, the calculation takes into account the relative importance of each value in the average, providing a more accurate representation of the underlying trends.
To calculate a weighted moving average, you need to assign weights to each data point in your dataset. The weights can be based on a variety of factors, such as time period, volatility, or other relevant variables. Typically, the most recent data points are given higher weights, while older data points are given lower weights.
Once the weights are assigned, you multiply each data point by its corresponding weight and sum up the results. Then, you divide the sum of the weighted values by the sum of the weights to get the weighted moving average. This calculation can be done manually using Excel formulas, or you can use built-in functions to automate the process.
Read Also: Understanding the Simple Average Method in Supply Chain Management
Weighted moving averages can be a valuable tool in analyzing and forecasting data, particularly in financial markets where trends and patterns can provide valuable insights. By understanding how to calculate and interpret weighted moving averages, you can make more informed decisions based on the underlying data.
A weighted moving average is a commonly used statistical calculation that gives more importance or weight to recent data points, while assigning less weight to older data points. This type of average can be useful for smoothing out data series and identifying trends.
Read Also: Step-by-Step Guide: How to Add SMA to MT4
To calculate a weighted moving average in Excel, follow these steps:
Here is an example of how to calculate a weighted moving average using Excel:
| Period | Data Point | Weight | Weighted Data Point |
|---|---|---|---|
| 1 | 10 | 0.2 | 2 |
| 2 | 15 | 0.3 | 4.5 |
| 3 | 20 | 0.5 | 10 |
| 4 | 25 | 0.8 | 20 |
| 5 | 30 | 0.2 | 6 |
In this example, the weighted moving average for the first period would be calculated as (2 + 4.5 + 10 + 20 + 6) / (0.2 + 0.3 + 0.5 + 0.8 + 0.2) = 12.35.

By following these steps, you can easily calculate weighted moving averages in Excel and use them to analyze and interpret your data.
A weighted moving average is a calculation that assigns different weights to different periods of data, giving more importance to recent data points. It is commonly used in finance and statistics to analyze trends and forecast future values.
To calculate a weighted moving average in Excel, you need to assign weights to each data point and then multiply each data point by its corresponding weight. After that, you sum up these weighted values and divide by the sum of the weights. This will give you the weighted moving average.
Sure! Let’s say we have the following data: 10, 15, 20, 25, 30. And the corresponding weights are: 1, 2, 3, 2, 1. To calculate the weighted moving average, you multiply each data point by its weight: (10 * 1) + (15 * 2) + (20 * 3) + (25 * 2) + (30 * 1) = 10 + 30 + 60 + 50 + 30 = 180. Then, you sum up the weights: 1 + 2 + 3 + 2 + 1 = 9. Finally, divide the sum of the weighted values by the sum of the weights: 180 / 9 = 20. So, the weighted moving average is 20.
Yes, you can use different weights for a weighted moving average in Excel. The weights can be any values you choose, as long as they sum up to 1 (or 100% if you prefer using percentages). You can assign higher weights to more recent data points if you want to give them more importance in the calculation.
Weighted moving averages have various practical applications. They are commonly used in finance to analyze stock prices, in sales forecasting to predict future sales based on historical data, in technical analysis to identify trends in market data, and in many other fields where analyzing trends and forecasting are important.
A weighted moving average is a method used to calculate the average of a series of data points, with each data point being given a different weight. The weights are assigned based on their importance or significance. This means that some data points might have more influence on the average than others.
To calculate a weighted moving average, you need to multiply each data point by its corresponding weight, and then sum up the products. This sum is then divided by the total weight of all data points to get the weighted moving average. The weights can be assigned as percentages or any other values depending on the method or criteria you are using.

Eligibility to Hold Shares in an S Corporation An S corporation, also known as an S corp, is a type of business structure that provides certain tax …
Read Article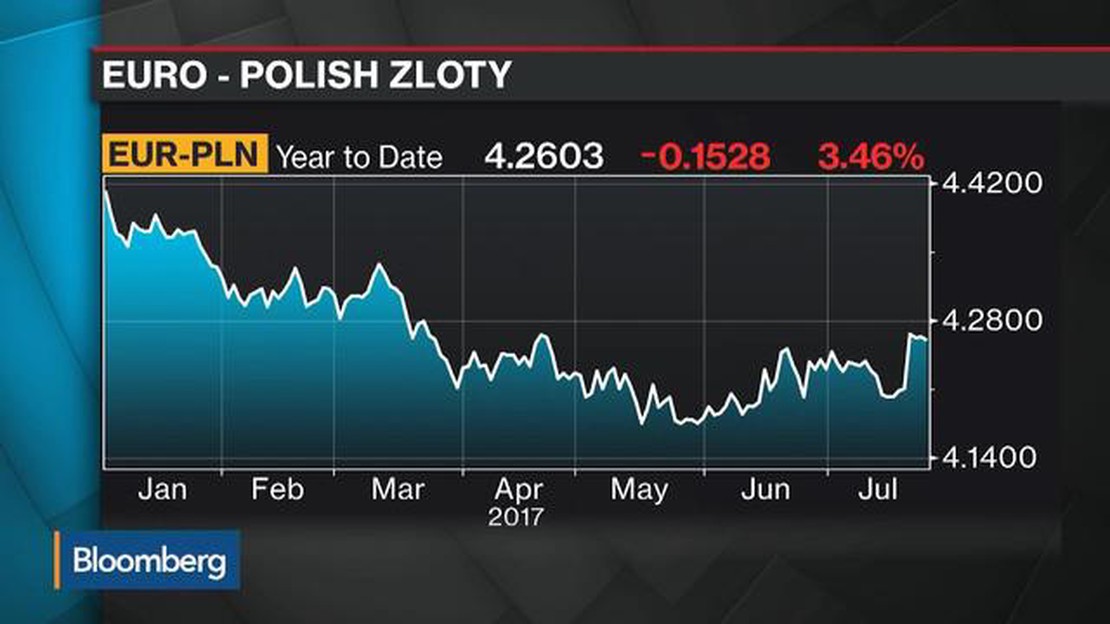
Reasons for the Strengthening of the Zloty The Zloty, the national currency of Poland, has been experiencing a significant strengthening in recent …
Read Article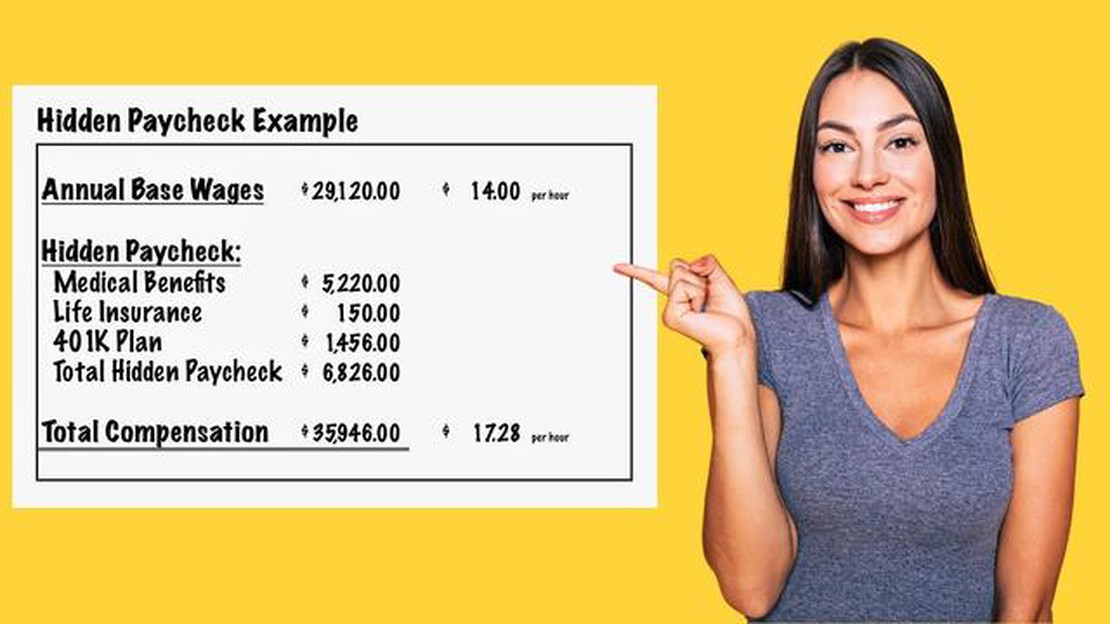
What Is Total Compensation Cost? When considering employee benefits, it is crucial for organizations to understand the concept of total compensation …
Read Article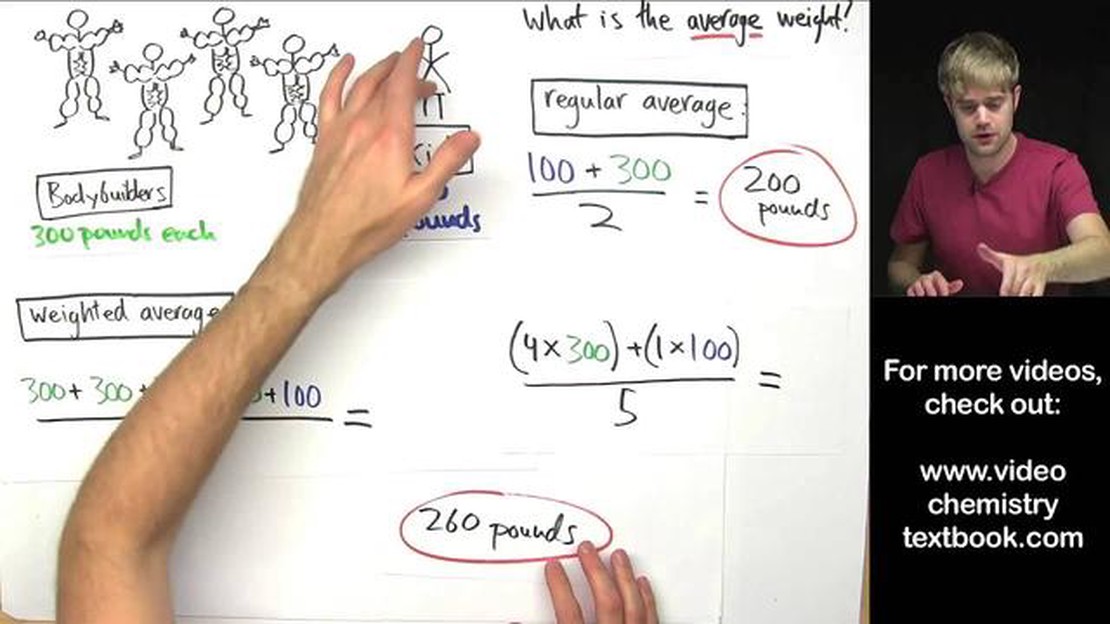
Why choose weighted average over average? When it comes to calculating averages, there are different methods to consider, such as the weighted average …
Read Article
Calculating average in VB: a comprehensive guide Calculating the average of a set of numbers is a fundamental task in many programming languages, …
Read Article
Is the Forex Market Closed on Saturday? The Forex market, also known as the foreign exchange market, is a global marketplace where traders buy and …
Read Article


