


1m Trading Strategy: Unveiling the Secrets of Successful Short-Term Trading
Exploring the 1m Trading Strategy: A Simple and Effective Approach Short-term trading, also known as day trading, is a popular investment strategy …
Read Article
Calculating moving averages is a common statistical technique used to analyze time series data in Minitab. This technique helps to smooth out irregularities and identify trends or patterns over a specific period of time. In this step-by-step guide, we will explore the process of calculating moving averages in Minitab and provide a comprehensive overview of the necessary steps.
Step 1: Prepare your data
Before calculating moving averages in Minitab, it is important to ensure that your data is organized and formatted correctly. Make sure that your data is in a time series format, where each observation corresponds to a specific time period. Additionally, ensure that your data set is complete and does not contain any missing values.
Tip: It is recommended to import your data into Minitab or manually enter it into a Minitab worksheet for easy analysis.
Step 2: Determine the window size

The next step is to determine the window size for your moving average calculation. The window size refers to the number of consecutive observations that will be used to calculate the average at each point. This decision should be based on the characteristics of your data and the level of smoothing desired. A smaller window size will result in a more responsive moving average, while a larger window size will offer a smoother, less reactive average.
Step 3: Calculate the moving average
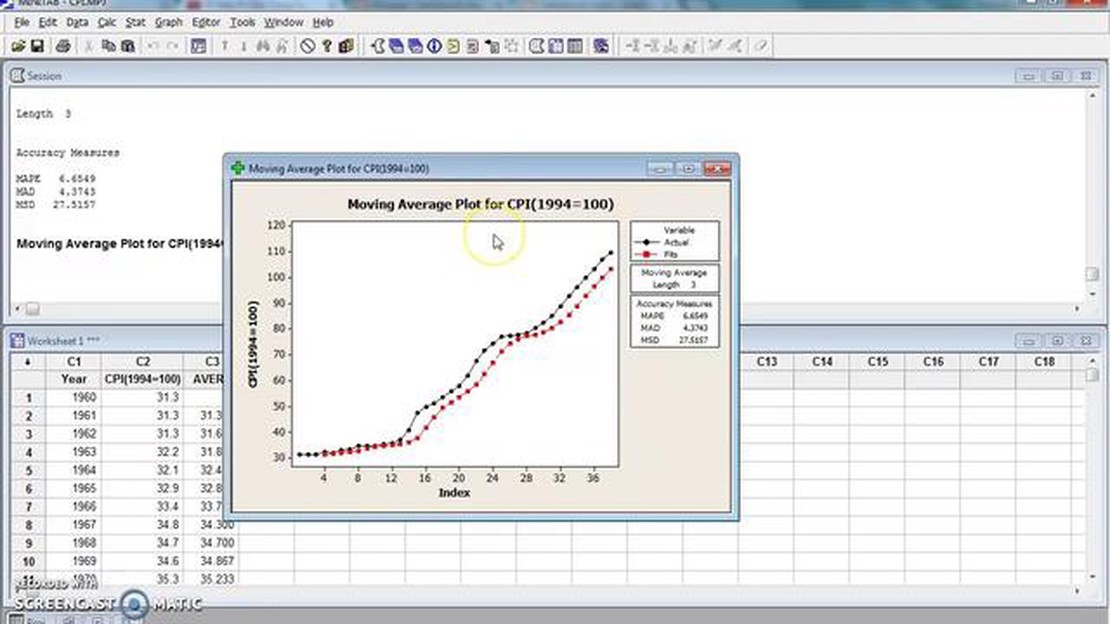
Once you have determined the window size, you can proceed to calculate the moving average using Minitab. In Minitab, navigate to the “Calc” menu, select “Time Series”, and then choose “Moving Average”. Specify the appropriate column or variable for the calculation and enter the desired window size. Minitab will generate a new column with the calculated moving averages.
Step 4: Interpret the results
After calculating the moving averages, it is important to interpret the results in the context of your data and research goals. Examine the trend and pattern of the moving averages over time to identify any significant changes or patterns. Additionally, consider comparing the moving averages with the original data to gain insights into the overall behavior of the time series.
Read Also: Understanding the Hull Moving Average in Multicharts: How it Works and its Benefits
Note: The moving averages can be used for forecasting future values or identifying anomalies in the data.
By following these steps and utilizing Minitab’s powerful tools, you can effectively calculate moving averages and gain valuable insights from your time series data.
Read Also: Which Bank Offers the Lowest Conversion Rate? Find Out Here
Moving average is a statistical calculation used to analyze time series data. It is a commonly used method to identify trends and patterns in data over a specific period of time. The moving average is calculated by taking the average of a set of data points within a specified window or interval.
By calculating moving averages, you can smooth out fluctuations in data and identify the underlying patterns or trends that may be hidden. This can be useful in various fields such as finance, economics, and forecasting, among others.
The concept of moving average is based on the principle that by taking the average of data points over a certain period, you can obtain a more representative value that reflects the overall trend of the data. This is particularly helpful when dealing with noisy or volatile data, as the moving average can smooth out the random fluctuations.
There are different types of moving averages that can be calculated, such as simple moving average (SMA) and exponential moving average (EMA). The choice of the type of moving average to use depends on the specific application and the characteristics of the data being analyzed.
Moving averages are widely used in data analysis and forecasting. They can help in identifying trends, forecasting future values, and making informed decisions based on historical data. By calculating moving averages, you can gain insights into the underlying patterns and dynamics of the data, which can be valuable in various fields and industries.

The moving average is a widely used statistical method for analyzing time series data. It offers several benefits that make it a popular choice for data analysis:
In conclusion, moving average is a powerful tool in data analysis that offers several benefits such as trend detection, seasonality identification, outlier detection, forecasting, and data smoothing. By leveraging these benefits, you can gain valuable insights and make informed decisions based on your time series data.
A moving average is a statistical calculation used to analyze data over a certain period of time. It is used to smooth out fluctuations and identify trends in the data.
Calculating moving averages in Minitab allows for efficient data analysis and trend identification. It provides a visual representation of data patterns and helps in making informed decisions based on the analysis.

Exploring the 1m Trading Strategy: A Simple and Effective Approach Short-term trading, also known as day trading, is a popular investment strategy …
Read Article
Calculating RR in trading: A comprehensive guide Risk to reward ratio (RR) is a crucial concept in trading. It is a metric that allows traders to …
Read Article
Choosing the Best Indicator to Use with Bollinger Bands Bollinger Bands are a popular technical analysis tool used to assess market volatility and …
Read Article
Choosing the Right Broker: Tips to Consider A broker is a crucial partner for anyone looking to invest in the financial markets. Whether you are a …
Read Article
An Introduction to the Double Bollinger Band Indicator for MT4 The Double Bollinger Band indicator is a powerful tool for technical analysis in the …
Read Article
Understanding the Fundamentals of Price Action Trading Price action trading is a popular and effective strategy used by many successful traders in the …
Read Article


