

Can You Trade Futures All Day? Discover the Trading Hours and Opportunities
Can you trade futures all day? Trading futures can be an exciting and potentially profitable venture, but it’s important to understand the trading …
Read Article
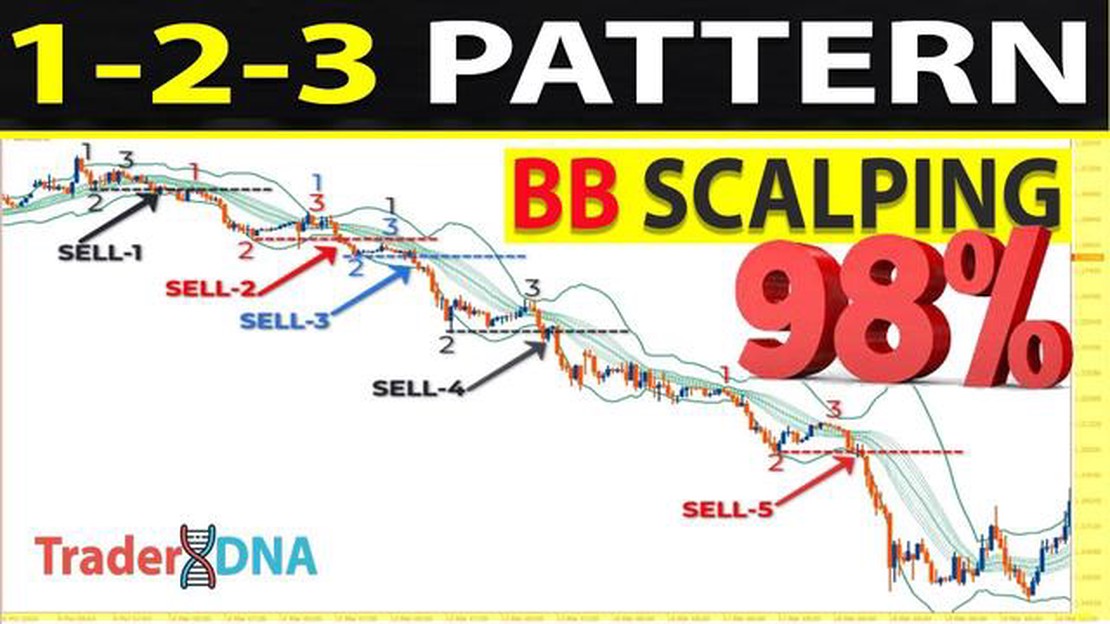
The Double Bollinger Band indicator is a powerful tool for technical analysis in the Forex market. It is widely used by traders to identify potential trend reversals, as well as to determine entry and exit points for their trades. In this comprehensive guide, we will explore everything you need to know about the Double Bollinger Band indicator and how to effectively use it in your own trading strategies.
First introduced by John Bollinger in the 1980s, the Double Bollinger Band indicator consists of two sets of Bollinger Bands plotted on a price chart. The standard Bollinger Bands are plotted at a standard deviation of 2 above and below a simple moving average, while the outer bands are plotted at a standard deviation of 3. This unique configuration allows traders to identify potential trade setups with a high degree of accuracy.
One of the key advantages of the Double Bollinger Band indicator is its ability to adapt to changing market conditions. By using different standard deviation levels, traders can adjust the indicator to suit their trading style and market volatility. This flexibility makes it a valuable tool for both short-term scalpers and long-term trend followers.
In this guide, we will cover how to interpret the signals generated by the Double Bollinger Band indicator, how to set up the indicator on the MT4 trading platform, and provide examples of how it can be used in real-world trading scenarios. Whether you are a beginner trader or an experienced professional, this guide will provide you with the knowledge and tools necessary to master the Double Bollinger Band indicator and improve your trading results.
The Double Bollinger Band Indicator is a technical analysis tool that is used to identify potential price trends in the financial markets. It is based on the concept of using two sets of Bollinger Bands to provide more reliable signals for traders.
Bollinger Bands are a popular volatility indicator that consists of a middle band, an upper band, and a lower band. The middle band is typically a simple moving average that represents the average price of the asset being analyzed. The upper band and the lower band are calculated based on the standard deviation of the price from the middle band.

The Double Bollinger Band Indicator takes this concept one step further by adding an additional set of Bollinger Bands. The first set of Bollinger Bands is based on a shorter time period, while the second set is based on a longer time period. This allows traders to analyze both short-term and long-term price trends simultaneously.
When the price is near the lower band of the shorter-term Bollinger Bands and the lower band of the longer-term Bollinger Bands, it is considered to be in the “Buy Zone”. Conversely, when the price is near the upper band of both sets of Bollinger Bands, it is considered to be in the “Sell Zone”. These zones indicate potential reversal points in the market.
Read Also: Understanding the Power of Leading Indicators in Day Trading
Traders can use the Double Bollinger Band Indicator in several ways. They can use it to identify potential trend reversals, to determine entry and exit points for trades, or as a filter for other trading signals. It can be applied to various financial instruments, including stocks, commodities, and forex.
| Advantages | Disadvantages |
|---|---|
| Provides clear buy and sell zones | May generate false signals in choppy markets |
| Offers a comprehensive view of both short-term and long-term trends | Requires understanding of Bollinger Bands and technical analysis |
| Can be used in conjunction with other indicators | Not foolproof and can still result in losses |
Overall, the Double Bollinger Band Indicator is a powerful tool for traders looking to improve their trading decisions. By combining two sets of Bollinger Bands, it provides clearer and more reliable signals, making it a valuable addition to any trader’s toolkit.
The Double Bollinger Band (DBB) indicator is a powerful tool that can help traders identify trend reversals, breakouts, and entry/exit points in the market. Here are some key ways to use the DBB indicator in your trading strategy:
Read Also: Running MT4 on Mac: Everything You Need to Know5. Trend Following: Traders can use the DBB indicator to follow the trend and stay in profitable trades for longer. For example, in an uptrend, the price tends to stay above the lower band and make higher highs. Traders can use this information to stay in long positions until the price crosses below the lower band or forms a bearish reversal pattern. Similarly, in a downtrend, the price tends to stay below the upper band and make lower lows. Traders can use this information to stay in short positions until the price crosses above the upper band or forms a bullish reversal pattern.
Overall, the Double Bollinger Band indicator can be a valuable tool in a trader’s arsenal. By using it in combination with other technical indicators and price action analysis, traders can increase their chances of making profitable trades in the market.

The Double Bollinger Band Indicator is a technical analysis tool that helps traders identify potential trends and reversals in the financial markets. It consists of two sets of Bollinger Bands, which are plotted above and below the price chart.
The Double Bollinger Band Indicator works by plotting two sets of Bollinger Bands on the price chart. The first set is based on a shorter period moving average, while the second set is based on a longer period moving average. By analyzing the position and width of the bands, traders can identify potential trends, breakouts, and reversals.
The Double Bollinger Band Indicator offers several advantages for traders. It helps identify potential trend reversals, provides entry and exit signals, and can be used for various time frames and markets. Additionally, it helps filter out false signals and provides a visual representation of price volatility.
The Double Bollinger Band Indicator can be used on any trading platform that supports the MetaTrader 4 (MT4) platform. MT4 is a popular trading platform among forex and CFD traders, and it offers a wide range of technical analysis tools, including the Double Bollinger Band Indicator.
The settings of the Double Bollinger Band Indicator can be optimized based on the trader’s trading style and preferences. Some traders prefer shorter period moving averages for more sensitive signals, while others prefer longer periods for smoother signals. Experimenting with different settings and backtesting can help determine the optimal parameters for individual trading strategies.

Can you trade futures all day? Trading futures can be an exciting and potentially profitable venture, but it’s important to understand the trading …
Read Article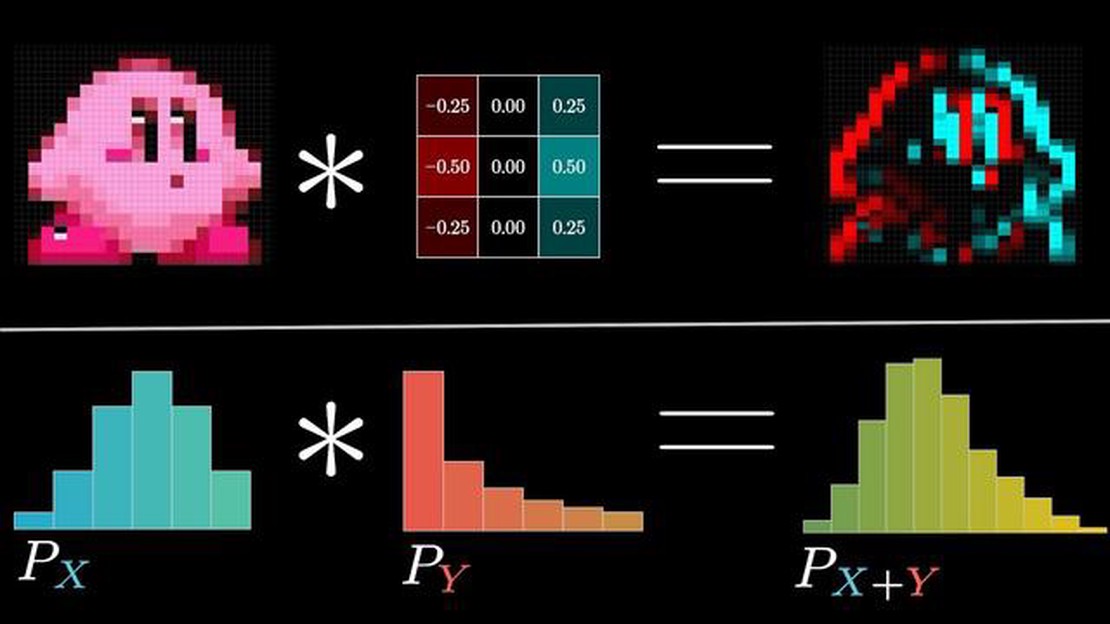
Understanding Convolution Average Filters The convolution average filter is a widely used technique in image processing and signal analysis. It is a …
Read Article
What is Moving Average in Supply Chain Management? The moving average is a statistical technique widely used in supply chain management to analyze and …
Read Article
Value of a 1000 Chilean peso bill The Chilean peso is the official currency of Chile, a country located in South America. The currency is issued and …
Read Article
Cardstock Paper Prices at FedEx: What to Expect If you are in need of high-quality cardstock paper for your printing needs, look no further than …
Read Article
Foreign Exchange Options: An Example and Explanation In the world of finance, foreign exchange options play a crucial role in managing risks …
Read Article


