


How Big is the Forex Market? Dive into its Vastness and Potential
How big is the forex market? The foreign exchange market, or forex market, is the largest and most liquid financial market in the world. With an …
Read Article
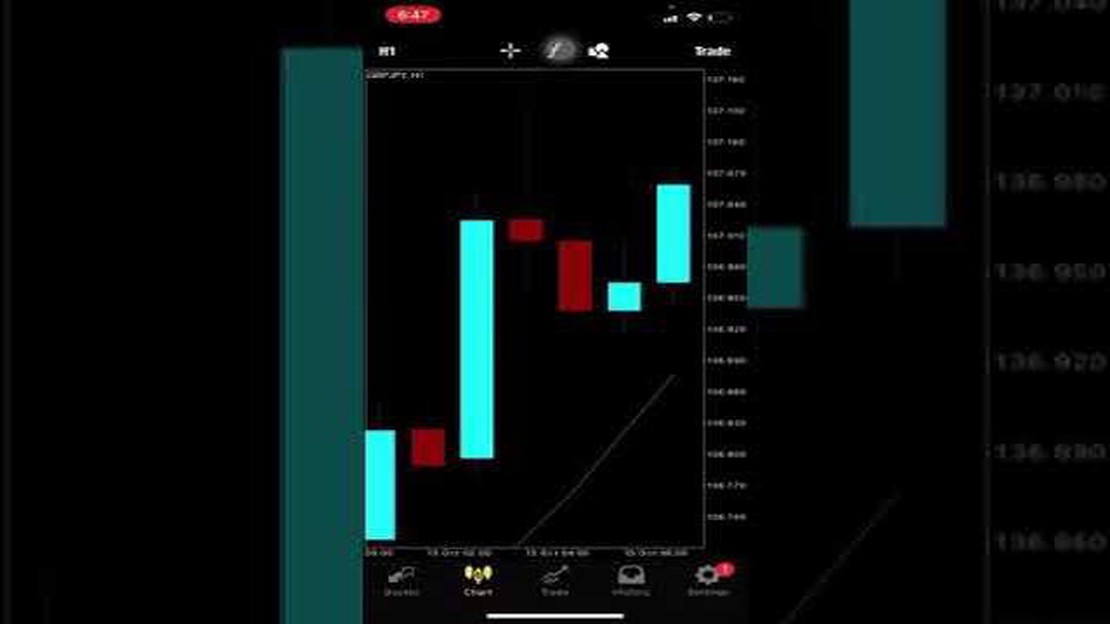
When it comes to trading in financial markets, understanding OHLC is crucial. OHLC stands for Open, High, Low, and Close, and it refers to the different price levels at which an asset traded during a given period of time. In this complete guide, we will delve into the concept of OHLC and how it is used in the popular trading platform MT4.
Open: The open price is the first price at which an asset trades during a specific time period. It represents the starting point for the trading session and is usually denoted by a horizontal line on a chart.
High: The high price is the highest price at which an asset trades during a specific time period. It represents the peak of the trading session and is often marked by a vertical line extending from the top of the horizontal line representing the open price.
Low: The low price is the lowest price at which an asset trades during a specific time period. It represents the bottom of the trading session and is usually marked by a vertical line extending from the bottom of the horizontal line representing the open price.
Close: The close price is the last price at which an asset trades during a specific time period. It represents the end point of the trading session and is often denoted by a horizontal line on a chart. The close price is important as it is used to calculate various technical indicators and determine the overall direction of the market.
Understanding OHLC is essential for traders using the MT4 platform. By analyzing these four price levels, traders can make informed decisions about when to enter or exit a trade. Whether you are a novice or an experienced trader, this complete guide will provide you with the knowledge and insights you need to effectively use OHLC in MT4 for successful trading.
In the world of forex trading, it’s important to have a solid understanding of the various price charts and indicators used to analyze the markets. One commonly used charting method is OHLC, which stands for Open, High, Low, Close. In this guide, we will explain what OHLC is and how it is used in MetaTrader 4 (MT4).
OHLC represents the four main price points for a specific time period, typically a candlestick on a chart. Here’s what each component of OHLC represents:

The OHLC values are usually displayed in a chart as vertical lines with horizontal dashes on either end. The line extends from the lowest price to the highest price, with the dashes representing the opening and closing prices.
Traders use OHLC data to identify patterns, trends, and potential entry and exit points in the market. For example, if the closing price is higher than the opening price, it may indicate a bullish trend. Conversely, if the closing price is lower than the opening price, it may suggest a bearish trend.
In MT4, OHLC data is readily available and can be viewed in various timeframes, such as daily, hourly, or even minute intervals. Traders can customize the chart settings to display OHLC data in the format that best suits their trading strategy.
By understanding OHLC and how to interpret the data, traders can gain valuable insights into market dynamics and make informed trading decisions. It’s important to note that OHLC is just one tool among many in a trader’s arsenal, and it is often used in conjunction with other technical indicators and analysis methods.
In conclusion, OHLC is a key component of technical analysis in forex trading. It provides vital information about price movements and helps traders identify trends and potential trading opportunities. With the help of MT4, traders can easily access and analyze OHLC data to refine their trading strategies and improve their chances of success in the markets.
Read Also: Is SBI forex card a good choice for international travelers?
OHLC stands for Open, High, Low, Close, which are the four main data points used to create a candlestick chart. These data points represent the prices at which a financial instrument (such as a currency pair, stock, or commodity) traded over a specific time period.
The open price is the level at which the instrument started trading at the beginning of the selected time period. The high price is the highest level that the instrument reached during that period. The low price, on the other hand, is the lowest level that the instrument reached during the same period. Finally, the close price is the level at which the instrument ended trading at the end of the selected time period.
Read Also: Is Trading an Addictive Behavior? Learn About the Risks and Consequences
OHLC data is used to visually represent price movements, trends, and patterns on a chart. Candlestick charts are the most common type of chart used to display OHLC data, with each candlestick representing a specific time period. The body of the candlestick represents the open and close prices, while the wicks (or shadows) represent the high and low prices.
In MT4, OHLC data is readily available for each candlestick on different timeframes, ranging from one minute to monthly charts. Traders and analysts use this data to perform technical analysis, identify key support and resistance levels, and make informed trading decisions based on historical price patterns.
Understanding OHLC in MT4 is essential for any trader who wants to analyze price data and make informed trading decisions. By studying OHLC data and candlestick patterns, traders can gain insights into market trends and potential future price movements.
OHLC, or Open High Low Close, is a key concept in MT4 because it provides important information about financial market pricing within a specific time frame. Traders and analysts use OHLC data to gain insights into price movements and make informed decisions.
The Open price refers to the first traded price at the beginning of a time interval, whether it’s a minute, hour, day, or week. It is represented by a horizontal line on a chart. The High and Low prices indicate the highest and lowest traded prices during the time interval, respectively. These are represented by vertical lines extending from the Open price line. Finally, the Close price is the last traded price at the end of the time interval, and it is represented by another horizontal line.

By analyzing OHLC data, traders can identify important market trends and patterns. For example, a higher High price combined with a higher Close price may indicate a bullish trend, while a lower High price combined with a lower Close price may indicate a bearish trend. Traders can also use OHLC data to identify support and resistance levels, as well as potential entry and exit points for trades.
MT4 provides a range of tools and indicators that allow traders to analyze OHLC data and incorporate it into their trading strategies. These tools include OHLC charts, which visually display the Open, High, Low, and Close prices in a specific time frame, as well as various technical indicators that use OHLC data to generate buy or sell signals.
Overall, understanding and interpreting OHLC data is crucial for traders using MT4. It provides valuable insights into price movements and allows traders to make informed decisions based on historical price data. By incorporating OHLC analysis into their trading strategies, traders can improve their chances of success in the financial markets.
OHLC, which stands for Open, High, Low, and Close, represents the four crucial price points of a trading period. It is a common method of displaying price data in a candlestick chart.
The Open value is the price at which the trading period opened, the High value is the highest price reached during the period, the Low value is the lowest price reached, and the Close value is the price at which the period closed.
OHLC data provides valuable insights into the price movement and volatility of an asset. By analyzing these values, traders can identify trends, support and resistance levels, and potential entry and exit points for their positions.
Yes, the timeframe for OHLC data can be changed in MT4. Traders can select different timeframes, such as minutes, hours, days, or even weeks, to view OHLC data for different periods and gain a better understanding of the price action.

How big is the forex market? The foreign exchange market, or forex market, is the largest and most liquid financial market in the world. With an …
Read Article
Best Trading Platform for Forex Trading in China Forex trading has gained immense popularity in China, with thousands of traders actively …
Read Article
Revolut vs. Wise: comparing the two popular money transfer services In the age of digitized banking, traditional banks are no longer the only option …
Read Article
Side Effects of IV CT Scan: What You Need to Know An intravenous (IV) CT scan is a diagnostic procedure that uses a contrast material injected into a …
Read Article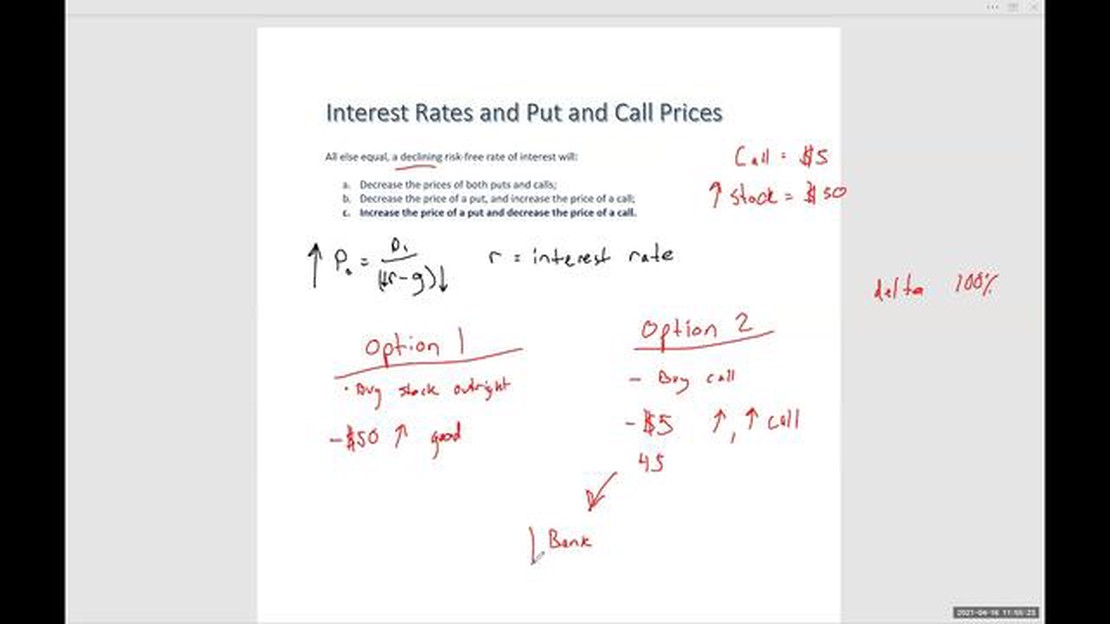
Understanding Interest Rates in Options Trading Interest rates play a crucial role in the world of options trading. Whether you are a beginner or an …
Read Article
What is the price of 1 euro in Pakistan open market? The exchange rate between the Euro and Pakistani Rupee is an important factor for those involved …
Read Article


