


How to Interpret Upper and Lower Control Limits: A Guide for Quality Control
Interpreting Upper and Lower Control Limits Quality control is a critical aspect of any business operation, ensuring that products and services meet …
Read Article
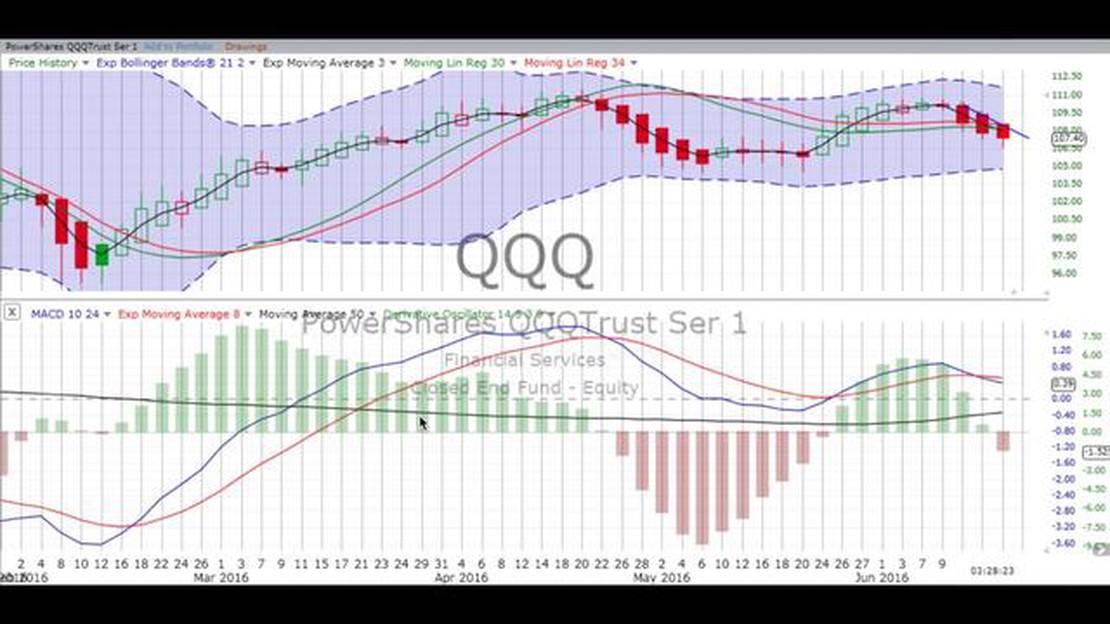
The MACD (Moving Average Convergence Divergence) is a popular technical indicator used in trading to identify potential buying and selling opportunities. It consists of two lines - the MACD line and the signal line - and is calculated by subtracting the 26-day exponential moving average (EMA) from the 12-day EMA. The MACD line crossing above the signal line is considered a bullish signal, while crossing below is considered bearish.
While the MACD indicator itself is useful for trend identification, calculating its derivative can provide additional insights into the strength and momentum of the trend. The derivative of the MACD indicator measures the rate at which the MACD is changing, indicating whether the trend is accelerating or decelerating.
To calculate the derivative of the MACD indicator, we can use the concept of finite differences. The finite difference is the difference between two consecutive values of a function. In this case, we can calculate the finite difference of the MACD line by subtracting the current MACD value from the previous MACD value.
Derivative = MACD(n) - MACD(n-1)
By calculating the derivative of the MACD indicator, traders can gain insights into the momentum of the trend and potential changes in direction. A positive derivative indicates an accelerating bullish trend, while a negative derivative suggests a decelerating or bearish trend. Traders can use this information to make informed decisions about their trading strategies and potential entry and exit points.
The Moving Average Convergence Divergence (MACD) is a popular technical analysis tool used by traders to spot potential trend reversals, determine momentum, and generate buy and sell signals. It consists of two lines: the MACD line and the signal line.
The MACD line is calculated by subtracting the 26-day exponential moving average (EMA) from the 12-day EMA. It represents the difference between the two moving averages and acts as a momentum indicator.
The signal line is a 9-day EMA of the MACD line. It smooths out the MACD line and generates trading signals when it crosses above or below the MACD line.
Positive MACD values indicate that the short-term EMA is above the long-term EMA, suggesting bullish momentum. Negative MACD values indicate the opposite, indicating bearish momentum.
Traders often look for three key signals from the MACD indicator:
The MACD indicator is commonly used in conjunction with other technical indicators and chart patterns to confirm trading signals and improve accuracy.

Understanding how the MACD indicator works and how to interpret its signals can help traders make informed decisions and improve their trading strategies.
The MACD (Moving Average Convergence Divergence) is a popular technical analysis tool used by traders to identify potential trend reversals and generate buy or sell signals. It is a trend-following momentum indicator that shows the relationship between two moving averages of a security’s price.
Read Also: Drawbacks of Using Moving Average as a Trading Indicator
The MACD indicator is composed of three key components:
Traders use the MACD indicator in various ways. One common approach is to look for crossover signals where the MACD line crosses above or below the Signal line. A bullish crossover occurs when the MACD line crosses above the Signal line, indicating a potential buying opportunity. Conversely, a bearish crossover occurs when the MACD line crosses below the Signal line, indicating a potential selling opportunity.
The MACD histogram is also used to identify potential buy or sell signals. When the histogram bars are positive and increasing in size, it suggests that bullish momentum is strengthening. Conversely, when the histogram bars are negative and decreasing in size, it suggests that bearish momentum is strengthening.
Overall, the MACD indicator is a versatile tool that helps traders identify the direction and strength of a trend. By understanding how to interpret its components and signals, traders can make informed trading decisions and potentially improve their profitability.
The Moving Average Convergence Divergence (MACD) is a popular technical indicator used by traders to track the strength and direction of a trend. It is calculated based on the difference between two moving averages of an asset’s price.
To calculate the MACD, follow these steps:
Read Also: Find the Swift Code for BPI IBAN Transactions | Guide and Information
The MACD line represents the difference between the two moving averages, while the signal line is a smoothed version of the MACD line that helps traders identify when to buy or sell an asset.
When the MACD line crosses above the signal line, it is considered a bullish signal, indicating a potential buy opportunity. On the other hand, when the MACD line crosses below the signal line, it is considered a bearish signal, indicating a potential sell opportunity.

Traders often use the MACD in conjunction with other technical indicators and analysis techniques to make more informed trading decisions.
Example:
Let’s say we have the following closing prices for an asset over a 30-day period:
$10.00, $10.50, $11.25, $11.75, $11.50, $10.75, $11.00, $11.25, $11.50, $11.25, $11.75, $12.00, $11.50, $12.25, $12.75, $13.00, $12.50, $12.75, $12.50, $12.25, $12.00, $11.75, $12.25, $12.50, $12.75, $13.00, $12.50, $12.25, $12.00, $11.75
Using these prices, we can calculate the MACD as follows:
In this example, we would have the values of the MACD line and the signal line for each day of the 30-day period. These values can be plotted on a chart to visualize the trend and potential buy/sell signals.
The MACD indicator, or Moving Average Convergence Divergence indicator, is a technical analysis tool used to detect changes in momentum, direction, and duration of a trend in a financial market. It is calculated using the difference between two exponential moving averages (EMA) of an asset’s price.
The MACD indicator is calculated by subtracting the 26-day exponential moving average (EMA) of an asset’s price from the 12-day EMA. The result is then plotted on a chart as the MACD line. Additionally, a 9-day EMA, called the signal line, is calculated from the MACD line to provide buy and sell signals.
The MACD histogram represents the difference between the MACD line and the signal line. It is plotted as a bar chart above or below the zero line. Positive values indicate bullish momentum, while negative values indicate bearish momentum. The height and width of the bars can provide insights into the strength of the trend and potential reversals.
To calculate the derivative of the MACD indicator, you need to take the derivative of each of the exponential moving averages (EMA) used in the calculation. This can be done by applying the chain rule of differentiation. For example, to find the derivative of the MACD line, you would take the derivative of the 12-day EMA and the 26-day EMA separately, and then subtract the two derivatives.

Interpreting Upper and Lower Control Limits Quality control is a critical aspect of any business operation, ensuring that products and services meet …
Read Article
Are stock options considered when filling out FAFSA? When it comes to reporting your financial information on the Free Application for Federal Student …
Read Article
Is Currency Trading Real? Forex trading, also known as currency trading, has gained popularity in recent years as an alternative investment …
Read Article
Employee Stock Option Introduction: Everything You Need to Know Employee stock options are a valuable tool that many companies use to reward and …
Read Article
Books to Learn Forex Trading: Valuable Guides for Success Forex trading is a complex and highly competitive field that requires in-depth knowledge and …
Read Article
Understanding Genetic Algorithms in Quantitative Finance Quantitative finance is a field that combines mathematical models and statistical techniques …
Read Article


