


Is Short-Term Trading Legit? Exploring the Pros and Cons
Is Short-Term Trading Legit? Short-term trading, also known as day trading or swing trading, involves buying and selling financial assets within a …
Read Article
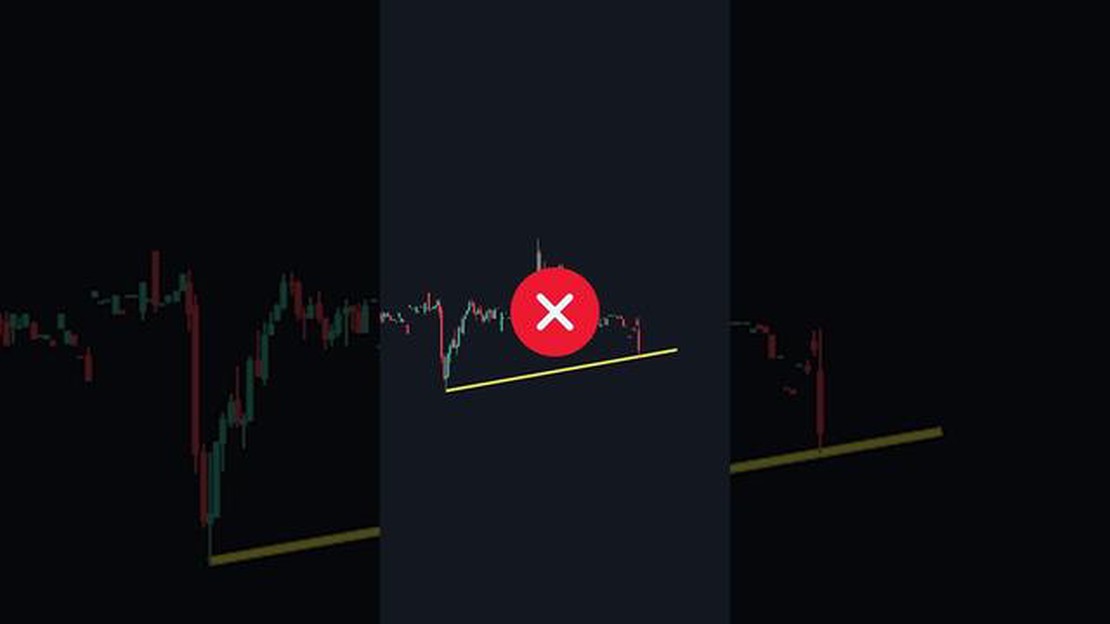
Drawing trendlines is an essential skill for any technical analyst or trader. Trendlines help to identify the direction of price movement and provide valuable insights into market trends. They are used to identify support and resistance levels, as well as potential entry and exit points.
What are trendlines?
Trendlines are straight lines drawn on a price chart to connect two or more significant points, such as peaks or troughs. They serve as visual guides to help traders identify the dominant direction of price movement and provide a framework for making trading decisions.
Why are trendlines important?
Trendlines are important because they help traders visualize market trends and identify potential reversal points. By plotting trendlines, traders can gain a better understanding of market dynamics and make more informed trading decisions. Trendlines also serve as a tool for risk management, as they provide clear levels of support and resistance.
“Trendlines are powerful tools that can help traders spot potential trading opportunities and determine the best entry and exit points.”
How to draw trendlines?

When drawing trendlines, there are a few rules and techniques to keep in mind. First, it’s important to identify significant peaks or troughs on the price chart. These points should be clearly visible and represent areas where price has reversed direction.
Once the significant points have been identified, connect them with a straight line. The trendline should extend beyond the current price action and encompass as many touchpoints as possible. The more touchpoints the trendline has, the stronger it is considered to be.
It’s important to note that trendlines can be subjective and may vary depending on the timeframe and trading strategy. Traders should exercise discretion when drawing trendlines and adjust them as necessary to fit their analysis or trading approach.
In conclusion, understanding the rules and techniques for drawing trendlines is crucial for successful technical analysis and trading. Trendlines provide valuable insights into market trends and can help traders make more informed trading decisions. By mastering the art of drawing trendlines, traders can gain a competitive edge in the market and enhance their trading strategies.
Read Also: Effective Strategies to Promote Your Forex Affiliate Links
Trendlines are an essential tool in technical analysis for identifying and understanding market trends. They are a visual representation of the direction and strength of a price movement over a period of time. By drawing trendlines on a chart, traders and investors can gain valuable insights into the market’s behavior and make informed decisions.
One of the key advantages of trendlines is their ability to provide support and resistance levels. When a trendline is drawn on a chart, it can act as a barrier that price must break through or bounce off of. Support and resistance levels can be used to identify potential entry and exit points, as well as areas to place stop-loss orders to manage risk.
Trendlines can also be used to identify trend reversals. When a trendline is broken, it can indicate a potential shift in the market’s direction. This can be a valuable signal for traders, as it can help them anticipate and take advantage of new trends before they fully develop.
Furthermore, trendlines can help traders determine the strength of a trend. By drawing multiple trendlines on a chart, traders can assess the angle and steepness of a trend. Steep trendlines indicate strong and rapid price movement, while shallow trendlines suggest a more gradual trend. This information can be useful in determining the overall momentum and volatility of a market.
Overall, understanding the importance of trendlines in drawing is essential for any trader or investor looking to make informed decisions in the financial markets. By utilizing trendlines, traders can gain valuable insights into the market’s behavior, identify potential support and resistance levels, anticipate trend reversals, and assess the strength of a trend. As with any technical analysis tool, it is important to use trendlines in conjunction with other indicators and analysis methods to validate signals and increase the accuracy of trading decisions.
There are various tools and techniques available to traders and investors when it comes to analyzing financial markets. One such technique is trendline analysis, which involves drawing lines on a price chart to identify and understand trends in the market.
Read Also: Strategies for Handling Missing Data in Time Series Analysis
In its simplest form, a trendline is a straight line that connects two or more significant price points on a chart. The line represents the trend of the market and can be used to make predictions about future price movements.
To draw a trendline, you need to identify at least two supporting points. These points can be either swing lows or swing highs, depending on whether you are drawing an uptrend or a downtrend line. For an uptrend line, you would connect two or more swing lows, while for a downtrend line, you would connect two or more swing highs.
Once the trendline is drawn, it acts as a dynamic support or resistance level. If the price breaks above an uptrend line, it could be an indication that the uptrend is strengthening. On the other hand, if the price breaks below a downtrend line, it could be a sign that the downtrend is gaining momentum.
Trendline analysis can also provide valuable insights into the strength and sustainability of a trend. The angle of the trendline can indicate the steepness of the trend, with a steeper line suggesting a stronger trend. Additionally, the length of the trendline can provide an estimate of how long the trend might continue.

It is important to note that trendlines are not foolproof and should be used in conjunction with other technical analysis tools to confirm trading decisions. They should also be regularly updated as new price information becomes available to ensure their accuracy and effectiveness.
In conclusion, trendline analysis is a basic yet powerful technique for understanding and predicting trends in the financial markets. By drawing trendlines and using them to analyze price movements, traders and investors can gain valuable insights that can help inform their trading decisions.
A trendline is a line that is drawn on a chart to represent the general direction of the price movement of a security or a market. It helps to identify the trend and make predictions about future price movements.
Understanding the rules and techniques for drawing trendlines is important because it helps traders and investors identify trends and make informed decisions in the financial markets. By accurately drawing trendlines, traders can determine potential buy and sell points and manage their risk effectively.
Yes, trendlines can be used for any financial market, including stocks, commodities, forex, and cryptocurrencies. The principles of drawing trendlines remain the same across different markets, but the specific price movements and trends may vary.

Is Short-Term Trading Legit? Short-term trading, also known as day trading or swing trading, involves buying and selling financial assets within a …
Read Article
Understanding the Weighted Moving Average in Weight Management In the field of weight recognition, one of the commonly used tools is the Weighted …
Read Article
Will GBP Strengthen Against USD? As the world’s most widely traded currency pairs, the relationship between the British pound (GBP) and the United …
Read Article
Is Forex Trading Legal in Malaysia? Forex trading, also known as foreign exchange trading, is a global decentralized market where currencies are …
Read Article
Restrictions and time limits for holding restricted stock Restricted stock, also known as restricted share units (RSUs), is a type of compensation …
Read Article
Understanding the Triangular Trade: A Historical Perspective The Triangular Trade was a historic trading route that linked Europe, Africa, and the …
Read Article


