

Are Employee Stock Options Limited to 100 Shares?
Employee Stock Options: Are They Based on 100 Shares? Employee stock options are often seen as a valuable compensation tool that allows employees to …
Read Article
The volatility smile plot is a powerful tool used in financial markets to visualize the implied volatility of options at different strike prices. Implied volatility is a measure of how much the market expects the price of an underlying asset to fluctuate over a given period of time. The volatility smile plot shows the relationship between implied volatility and the strike price of options, revealing valuable insights into market sentiment and pricing dynamics.
The shape of the volatility smile plot, which resembles a smile or smirk, is of great interest to traders and investors. Typically, the plot exhibits higher implied volatility for out-of-the-money options, especially those with deep out-of-the-money strikes. This indicates that market participants are pricing in a higher probability of extreme price movements in the underlying asset, as captured by the higher implied volatilities.
The existence of a volatility smile plot challenges the assumptions of the Black-Scholes model, which assumes that the underlying asset follows a log-normal distribution and that implied volatility is constant across strike prices and maturity dates. The volatility smile suggests that these assumptions may not hold in reality, as the market frequently experiences periods of heightened uncertainty and skewed price movements. Understanding and interpreting the volatility smile plot is therefore crucial for option traders and risk managers to accurately assess the true value and risk of their positions.
In this article, we will delve deeper into the meaning and implications of the volatility smile plot. We will explore the factors that contribute to the shape of the smile, including market supply and demand dynamics, market sentiment, and the relationship between implied volatility and options pricing. By gaining a better understanding of the volatility smile plot, market participants can make more informed decisions and effectively manage risk in their options portfolios.
The volatility smile plot is a graphical representation of the implied volatility levels of options with different strike prices but the same maturity. It is derived from the Black-Scholes-Merton model, which assumes that the underlying asset follows a geometric Brownian motion with a constant volatility. However, in reality, the implied volatility of options tends to exhibit a smile-shaped pattern.

The volatility smile plot is created by plotting the implied volatility of each option against its strike price. The result is a curve that resembles a smile, with higher implied volatilities for options at both in-the-money and out-of-the-money strike prices, and lower implied volatilities for at-the-money options. This indicates that market participants assign different probabilities and degrees of risk to various price movements of the underlying asset.
The volatility smile plot provides important insights into market expectations and risk perception. It highlights the market’s anticipation of potential extreme movements in the underlying asset’s price. The presence of a volatility smile suggests that traders and investors are willing to pay a higher premium for options that protect against large price swings, indicating a higher perceived risk in the market.
Moreover, the volatility smile plot also signifies deviations from the assumptions of the Black-Scholes-Merton model. This model assumes constant volatility, but the volatility smile implies that the market acknowledges the existence of time-varying volatility. This recognition of time-varying volatility has significant implications for option pricing and risk management strategies.
The volatility smile plot has several consequences for market participants. Firstly, it affects option pricing. The presence of a volatility smile indicates that the Black-Scholes-Merton model might underestimate the value of options, particularly those protecting against extreme price movements. Market participants must adjust their pricing models to account for the market’s implied volatility levels.
Secondly, the volatility smile plot impacts hedging strategies. Traders and investors seeking to offset their exposure to price movements may need to consider more sophisticated hedging techniques that account for the implied volatility skew. This could involve the use of additional options or dynamic strategies that adjust their positions based on changes in implied volatility.
Read Also: What enterprise system does Amazon use? | The technology behind Amazon's operations
Lastly, the volatility smile plot can potentially influence portfolio allocation decisions. The presence of a volatility smile suggests that market participants perceive higher risk for certain price movements. Investors may therefore allocate their portfolios differently, incorporating options with higher implied volatilities to hedge against potential large downside moves or leveraging options to capture potential upside gains.
In conclusion, the volatility smile plot holds great significance for market participants. It provides insights into market expectations, risk perception, and the deviations from the assumptions of the Black-Scholes-Merton model. Understanding and interpreting the volatility smile plot is crucial for option pricing, hedging, and portfolio management decisions.
The volatility smile plot is an important tool used in the field of finance to understand the implied volatility of options. It is a graphical representation of the relationship between the strike price of an option and its implied volatility. The plot takes the shape of a smile or smirk, hence the name volatility smile.
The volatility smile plot is derived by calculating the implied volatility of a range of options with different strike prices. Each option’s implied volatility is determined by solving an equation that equates the option’s market price with its theoretical price. The theoretical price takes into account factors such as the underlying asset’s price, the option’s strike price, the risk-free rate, and the option’s time to expiration.
Read Also: Top Forex Trading Platforms for Successful Traders - Choose Wisely
The volatility smile plot is a valuable tool for traders and investors because it provides insights into market expectations and potential risks. The shape of the smile reflects market participants’ beliefs about the distribution of possible future asset prices. For example, a pronounced smile indicates that traders expect larger price movements and increased uncertainty in the future. On the other hand, a flatter or inverted smile suggests that market participants anticipate smaller price movements and lower levels of uncertainty.
Furthermore, the volatility smile plot can help identify mispriced options. If the implied volatility of an option is significantly different from the average implied volatility of options with similar strike prices, it may indicate a potential trading opportunity. Traders can take advantage of these discrepancies by buying undervalued options and selling overvalued options.
It is important to note that the volatility smile plot is not a static indicator, but rather a dynamic one that evolves with market conditions. Changes in market sentiment, economic data, and other factors can cause the smile to shift, flatten, or invert. Therefore, it is crucial for traders and investors to regularly monitor the volatility smile plot to stay informed about changing market expectations and adjust their strategies accordingly.
| Advantages | Disadvantages |
|---|---|
| - Provides insights into market expectations | - Can be complex to interpret |
| - Helps identify mispriced options | - Subject to changes in market conditions |
| - Enables traders to take advantage of trading opportunities | - Requires constant monitoring |
The volatility smile plot is a graphical representation of the implied volatility of options with different strike prices but the same expiration date. It shows how the market perceives the risk and uncertainty of the underlying asset, with higher implied volatility indicating higher perceived risk.

The volatility smile indicates that the market expects higher volatility for options that are both in-the-money and out-of-the-money, compared to at-the-money options. This suggests that the market is pricing in the possibility of extreme price movements in the underlying asset.
The volatility smile is significant because it challenges the assumption of constant volatility in the Black-Scholes model, which assumes a flat volatility curve. The presence of a volatility smile suggests that the market perceives different levels of risk for different options, and this information can be used by traders and investors to make more informed decisions.
Traders and investors can use the information from the volatility smile plot to adjust their trading strategies and risk management techniques. For example, they can use the implied volatility levels to determine if options are overpriced or underpriced, and adjust their trading positions accordingly. Additionally, the volatility smile can provide insights into the potential range of price movements in the underlying asset, helping traders and investors to make more accurate predictions.

Employee Stock Options: Are They Based on 100 Shares? Employee stock options are often seen as a valuable compensation tool that allows employees to …
Read Article
Number of Employees at 360T When it comes to successful companies, one of the key factors that contribute to their growth and sustainability is their …
Read Article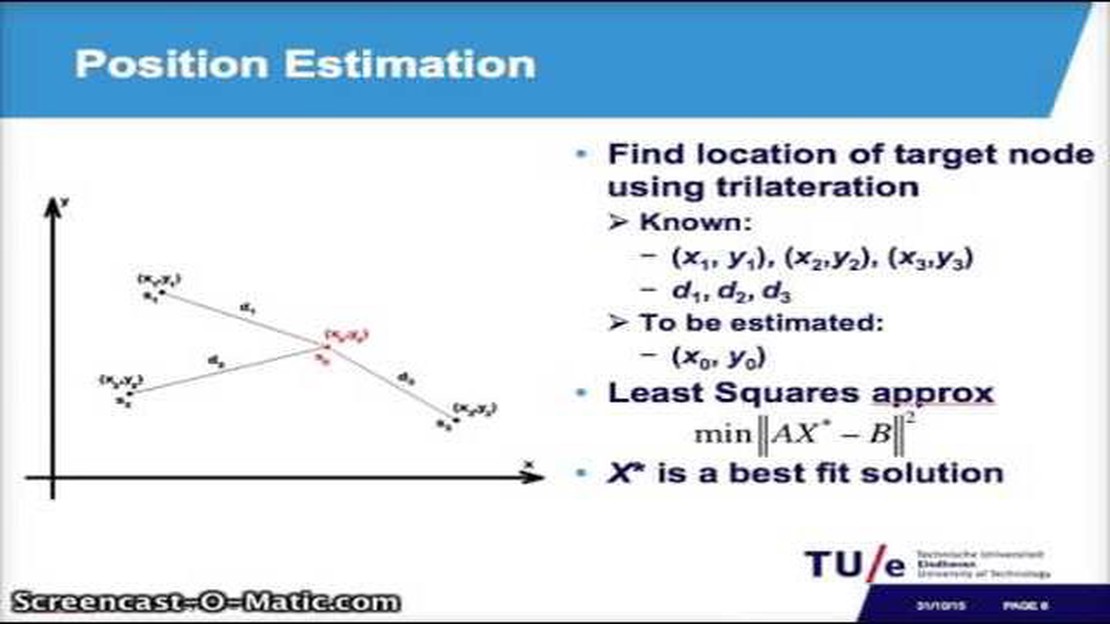
Understanding RSSI based location estimation In recent years, the emergence of wireless technologies has revolutionized the way we communicate and …
Read Article
Understanding the Commission Structure on Interactive Brokers When it comes to investing and trading in the financial markets, one important factor to …
Read Article
Transfer Money Abroad with RBL: A Step-by-Step Guide Transferring money abroad can be a complex and time-consuming process, especially when dealing …
Read Article
Is forex gain or loss taxable in the Philippines? Forex trading, also known as foreign exchange trading, has become increasingly popular in the …
Read Article


