
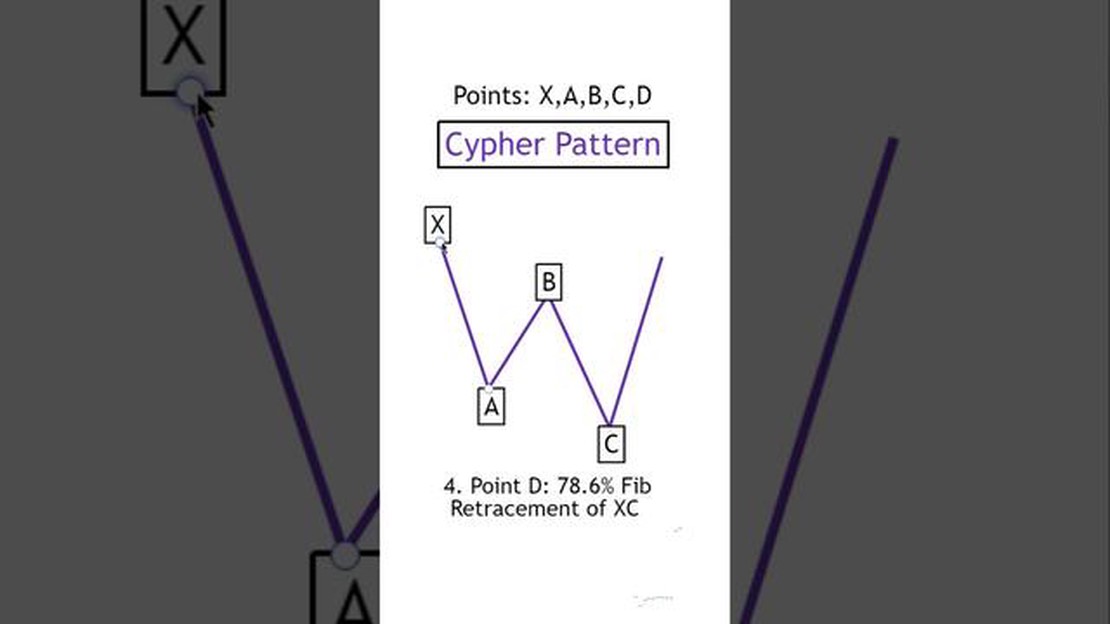

Understanding the Aftermath of a Cypher Pattern: What to Expect
Exploring the Outcome of a Cypher Pattern in Trading When it comes to the world of financial markets, there is no shortage of patterns and indicators …
Read Article
Bollinger Bands is a popular technical analysis tool used by traders to determine potential price reversals and volatility levels in the financial markets. Developed by John Bollinger in the 1980s, this indicator consists of three lines that provide valuable information about the current market conditions.
The first line is the middle band, which is a simple moving average (SMA) of the asset’s price over a specific period of time. The middle band is usually set to a 20-day SMA, although this can be adjusted based on the trader’s preferences. This line represents the average price and serves as a baseline for the other two lines.
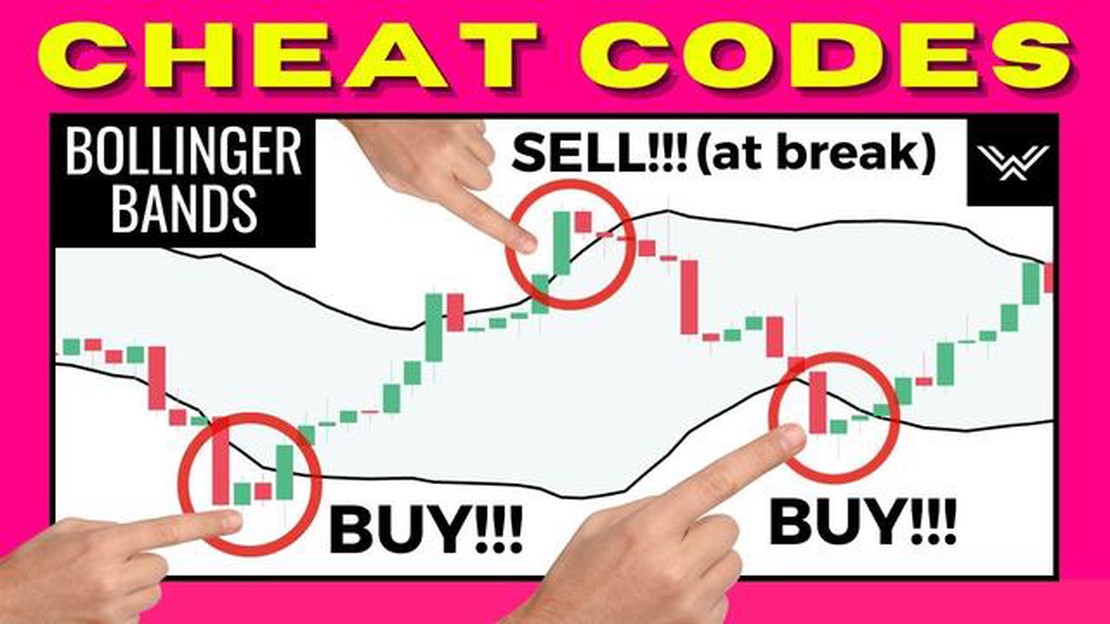
The second line is the upper band, which is calculated by adding two standard deviations to the middle band. Standard deviation is a measure of price volatility, so the upper band represents a higher price level that indicates an overbought condition. When the price touches or exceeds the upper band, it suggests that the asset may be overvalued and a price reversal could occur.
The third line is the lower band, which is calculated by subtracting two standard deviations from the middle band. This line represents a lower price level that indicates an oversold condition. When the price touches or falls below the lower band, it suggests that the asset may be undervalued and a price reversal could occur.
It’s important to note that the Bollinger Bands are not a standalone trading strategy, but rather a tool that can be used in conjunction with other indicators and analysis methods. Traders often use them in combination with trendlines, support and resistance levels, and other technical indicators to confirm potential trading opportunities.
In conclusion, understanding the three lines of the Bollinger Bands can provide valuable insights into market conditions and potential price reversals. By carefully analyzing the relationship between the middle band, upper band, and lower band, traders can make more informed decisions and improve their overall trading strategy.
Bollinger Bands are a technical analysis tool that was developed by John Bollinger in the 1980s. They consist of a simple moving average (SMA) line, an upper band, and a lower band. The SMA line represents the average price over a specified time period, while the upper and lower bands represent the standard deviation of the price.

The main purpose of Bollinger Bands is to provide traders with a visual representation of volatility in the market. When the price is moving within the bands, it indicates that the market is in a period of low volatility. On the other hand, when the price moves outside of the bands, it suggests that the market is experiencing increased volatility.
Traders often use Bollinger Bands to identify trading opportunities. When the price touches the upper band, it is considered overbought, and there is a chance that the price may reverse and move downwards. Conversely, when the price touches the lower band, it is considered oversold, and there is a chance that the price may reverse and move upwards.
In addition to identifying overbought and oversold conditions, Bollinger Bands can also be used to determine the strength of a trend. If the price is consistently staying close to the upper band, it indicates a strong uptrend. Conversely, if the price is consistently staying close to the lower band, it indicates a strong downtrend.
Read Also: Free Tick Data Sources: Where Can I Get Tick Data for Free?
| Symbol | SMA | Upper Band | Lower Band |
|---|---|---|---|
| AAA | 100 | 110 | 90 |
| BBB | 50 | 60 | 40 |
| CCC | 75 | 85 | 65 |
For example, in the table above, the SMA for the symbol AAA is 100. The upper band is 110, and the lower band is 90. This means that if the price of AAA moves above 110, it may be overbought, and if it moves below 90, it may be oversold.
Overall, Bollinger Bands are a valuable tool for traders to understand market volatility and identify potential trading opportunities. By analyzing the three lines of the Bollinger Bands, traders can make more informed decisions and improve their chances of success in the market.
To calculate Bollinger Bands, you need three key components:
Here’s a step-by-step guide on how to calculate Bollinger Bands:
| Step | Formula | Description |
|---|---|---|
| 1 | Calculate the SMA | Sum up the closing prices over a specified period and divide it by the number of periods. |
| 2 | Calculate the SD | Subtract each closing price from the SMA, square the result, sum up all the squared differences, divide it by the number of periods, and take the square root. |
| 3 | Calculate the Upper Bollinger Band (UBB) | Multiply the SD by the multiplier and add it to the SMA. |
| 4 | Calculate the Lower Bollinger Band (LBB) | Multiply the SD by the multiplier and subtract it from the SMA. |
Read Also: Understanding Options Signals: A Comprehensive Guide
The resulting Bollinger Bands consist of the SMA in the middle and the Upper and Lower Bollinger Bands above and below it, respectively. These bands help traders identify potential price levels of overbought and oversold conditions, as well as periods of consolidation.
The three lines of the Bollinger Bands are the upper band, the lower band, and the middle band. The upper and lower bands are calculated using a specified number of standard deviations from the middle band.
The Bollinger Bands are calculated by first determining the middle band, which is typically a simple moving average of the price over a specified period. The upper and lower bands are then calculated by adding and subtracting a certain multiple of the standard deviation from the middle band.

The Bollinger Bands serve multiple purposes in technical analysis. They can be used to identify overbought and oversold conditions, as well as to determine the current volatility and potential future price movements of a security.
The Bollinger Bands can be used to identify overbought conditions when the price touches or goes above the upper band, and oversold conditions when the price touches or goes below the lower band. Traders often interpret these situations as potential reversal points.
Yes, the Bollinger Bands can be used for trend analysis. When the price is consistently trading near the upper band, it may indicate an uptrend, while trading near the lower band may suggest a downtrend. Traders can also look for the bands to expand or contract, which can provide insight into the strength of a trend.
The three lines of the Bollinger Bands are the upper band, the middle band, and the lower band. The upper band is calculated by adding two standard deviations to the moving average, the middle band is the moving average itself, and the lower band is calculated by subtracting two standard deviations from the moving average.
The Bollinger Bands can be used to identify trend reversals by looking for price action near the bands. For example, if the price touches the upper band and then starts to move back towards the middle band, it could indicate a potential trend reversal. Additionally, if the price consistently touches the lower band and then starts to move back towards the middle band, it could also indicate a potential trend reversal.

Exploring the Outcome of a Cypher Pattern in Trading When it comes to the world of financial markets, there is no shortage of patterns and indicators …
Read Article
Division of assets and alimony: What is a wife entitled to in a divorce in Massachusetts? When a marriage comes to an end, it can be a difficult and …
Read Article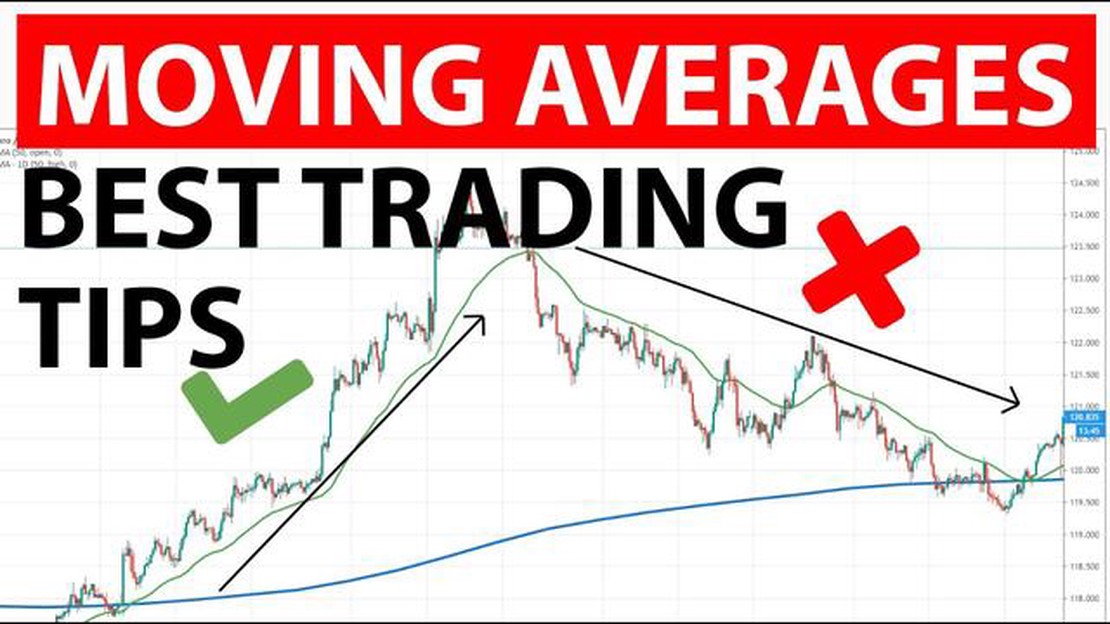
Which is better for swing trading: SMA or EMA? When it comes to swing trading, one of the key tools traders use is moving averages. Moving averages …
Read Article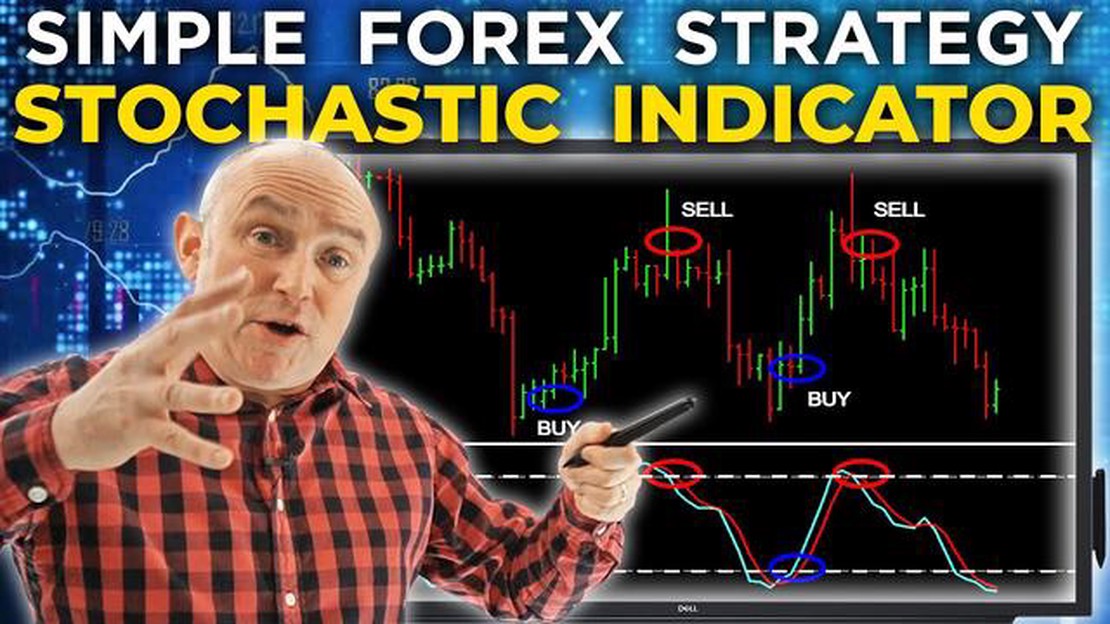
Trading forex with the stochastic indicator Are you looking to maximize your profits in the forex market? One way to do this is by utilizing the …
Read Article
Understanding Forex Technical Analysis When it comes to trading in the forex market, having a solid understanding of technical analysis is crucial. …
Read Article
Is trading a potential addiction? Trading, especially in the financial markets, can be an exciting and potentially lucrative activity. However, it can …
Read Article


