


Understanding the Role of a Forex Company: Key Responsibilities and Services
Understanding the Role of a Forex Company in the Financial Market When it comes to the world of international finance, Forex companies play a vital …
Read Article
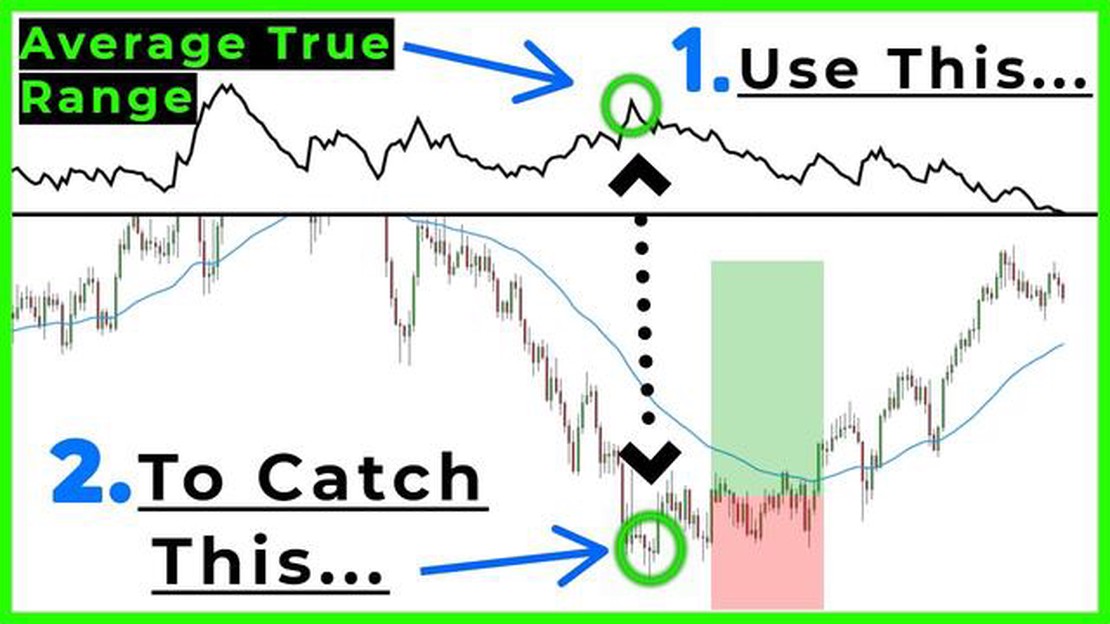
When it comes to trading in the financial markets, it’s important to have a solid strategy in place. One tool that can help you make more informed trading decisions is the Average True Range (ATR). ATR is a technical indicator that measures market volatility and can be used to determine the potential profit or loss of a trade.
ATR is calculated by taking the average of the true range over a specified period. The true range is the greatest of the following: the difference between the current high and the current low, the difference between the current high and the previous close, or the difference between the current low and the previous close. By calculating the average true range over a specific period, traders can gain insight into how volatile the market is and adjust their trading strategy accordingly.
One way to utilize ATR in your trading strategy is by setting stop loss and take profit levels. Since ATR measures market volatility, it can help you determine the appropriate distance to set your stop loss and take profit levels from your entry point. For example, if the ATR indicates high market volatility, you may want to set wider stop loss and take profit levels to account for potential price fluctuations. On the other hand, if the ATR indicates low market volatility, you may want to set tighter stop loss and take profit levels to maximize your potential profit.
Another way to use ATR is to identify potential entry and exit points. When the ATR is high, it may indicate that the market is trending or experiencing a significant price movement. This could be a signal to enter a trade or to exit an existing position. Conversely, when the ATR is low, it may indicate that the market is ranging or experiencing low volatility. This could be a signal to stay out of the market or to tighten your stops.
The Average True Range (ATR) is a technical indicator that measures the volatility of an asset’s price over a specific period of time. It provides traders with valuable insights into the level of price movement, helping them identify potential trading opportunities and set appropriate stop-loss levels.
The ATR is calculated by taking the average of the true ranges over the specified time period. The true range is the greatest of the following three values:

| Method | Calculation |
|---|---|
| Method 1 | High - Low |
| Method 2 | High - Previous Close |
| Method 3 | Low - Previous Close |
Once the true ranges are calculated, the ATR is determined by averaging these values over the specified time period. The most commonly used time period for the ATR is 14, but traders can adjust it to suit their trading style and time frame.
The ATR is typically displayed as a line chart or histogram below the main price chart. A higher ATR value indicates greater volatility, while a lower value suggests less volatility. Traders can use this information to adjust their trading strategies accordingly.
One common way to use the ATR is to set stop-loss levels. By setting a stop-loss level based on the ATR, traders can account for the natural price fluctuations and avoid getting stopped out too early or staying in a trade for too long. For example, if the ATR is 0.5, a trader might set their stop-loss level 1 ATR below the entry price to provide some room for price movement.
In addition to stop-loss levels, the ATR can also be used to identify potential breakout opportunities. When the ATR is low, it suggests that the market is experiencing low volatility and is likely to go through a period of consolidation. Conversely, a high ATR indicates that the market is experiencing high volatility, which can signal a potential breakout.
Read Also: Learn How to Create an MT5 Expert Advisor (EA) with Step-by-Step Guide
Overall, understanding and utilizing the Average True Range can greatly enhance a trader’s ability to make informed trading decisions. By incorporating the ATR into their trading strategy, traders can better manage risk, set appropriate stop-loss levels, and identify potential breakout opportunities.
The Average True Range (ATR) is a technical indicator used in trading to measure market volatility. It was developed by J. Welles Wilder Jr. and introduced in his book “New Concepts in Technical Trading Systems” in 1978. The ATR calculates the average true range of price movement over a specified period of time.
Read Also: Learn the Formula for Volume Weighted Average
The true range is defined as the greatest of the following:
Once the true range is calculated, the ATR is calculated as the moving average of the true range over the specified period of time. The most common period used is 14 days or periods, but traders can adjust this to their preference.
The ATR is typically displayed as a line chart or histogram below the price chart. It provides traders with a visual representation of market volatility, allowing them to make informed decisions about setting stop-loss orders, identifying possible trend reversals, and determining entry and exit points for trades.
A high ATR value indicates greater volatility, while a low ATR value indicates lower volatility. Traders often use the ATR in conjunction with other technical indicators to confirm signals and refine their trading strategy.
| Advantages of using ATR: | Disadvantages of using ATR: |
|---|---|
| - Helps identify potential trend reversals | - Does not provide directional bias |
| - Aids in setting appropriate stop-loss orders | - Can be lagging during fast market movements |
| - Provides a measure of market volatility | - Does not indicate the strength of a trend |
| - Can be used in conjunction with other indicators | - May give false signals in choppy markets |

In conclusion, the Average True Range is a useful tool for traders to assess market volatility and make informed trading decisions. By incorporating the ATR into their strategy, traders can better manage risk, identify potential reversals, and improve their overall trading performance.
Average True Range (ATR) is a technical analysis indicator that measures volatility in a trading instrument. It is calculated by taking the average of the true ranges over a specific period of time.
ATR can be used in a trading strategy to determine the appropriate placement of stop-loss orders. It can also be used to identify potential breakouts and reversals in price movements.
The formula for calculating ATR involves taking the average of the true ranges over a specific period of time. The true range is the greatest of the following: the current high minus the current low, the absolute value of the current high minus the previous close, or the absolute value of the current low minus the previous close.
Yes, ATR can be used for all types of trading instruments, including stocks, forex, commodities, and cryptocurrencies. The indicator is not specific to any particular market.

Understanding the Role of a Forex Company in the Financial Market When it comes to the world of international finance, Forex companies play a vital …
Read Article
What is a licensed forex trader? Forex trading has become increasingly popular in recent years, with many individuals looking to capitalize on the …
Read Article
How to Identify Promising Stocks for Options Trading Trading options can be a highly profitable investment strategy, but finding high-quality stocks …
Read Article
Is there a future for Citrix? Citrix Systems is a well-known software company that specializes in virtualization, networking, and cloud computing …
Read Article
Value of a 1000 Chilean peso bill The Chilean peso is the official currency of Chile, a country located in South America. The currency is issued and …
Read Article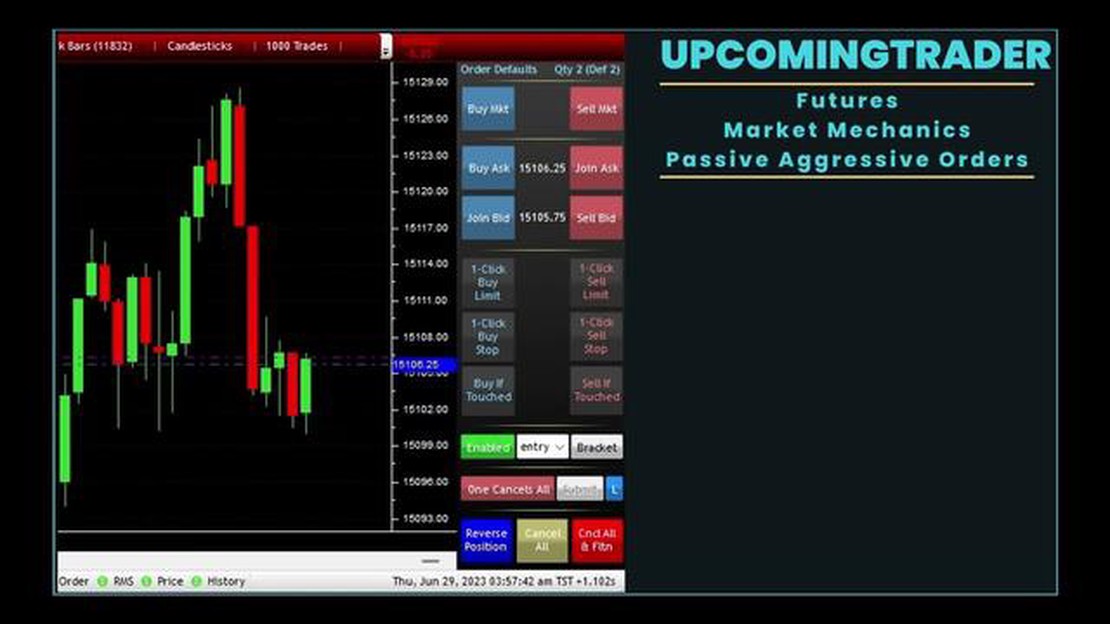
Understanding the Minimum Requirements for Trading Futures Trading futures can be an exciting and potentially profitable endeavor. Whether you are a …
Read Article


