


USD CNH Explained: Understanding the Currency Pair and its Significance
Understanding USD CNH: Definition, Features, and Significance The USD CNH currency pair refers to the exchange rate between the United States dollar …
Read Article
When it comes to trading in the forex market, having a solid understanding of technical analysis is crucial. Technical analysis is a method used by traders to forecast future price movements based on historical market data, such as price charts and trading volumes. By analyzing these patterns and trends, traders can make more informed decisions and potentially profit from the market.
This comprehensive guide aims to provide you with a deeper understanding of forex technical analysis and its various components. From support and resistance levels to chart patterns and indicators, we will cover everything you need to know to start using technical analysis in your trading strategy.
One of the key concepts in technical analysis is the idea that historical price patterns tend to repeat themselves. This is based on the belief that human psychology plays a significant role in shaping market trends. Traders use various tools and techniques to identify these patterns and predict future price movements.
Whether you are a beginner or an experienced trader, this guide will serve as a valuable resource to enhance your understanding of forex technical analysis. By mastering the art of technical analysis, you can gain a competitive edge in the forex market and increase your chances of success.
Forex technical analysis is a method of analyzing currency price movements using historical price data and statistical patterns. It involves studying charts, indicators, and other tools to identify patterns and trends that can help predict future price movements.
Technical analysis is based on the principle that past price movements can provide insights into future price movements. It assumes that patterns repeat themselves and that human psychology causes prices to move in predictable ways.
Traders who use technical analysis believe that by studying historical price data, they can identify potential trading opportunities and make more informed trading decisions.
There are several key components to forex technical analysis:

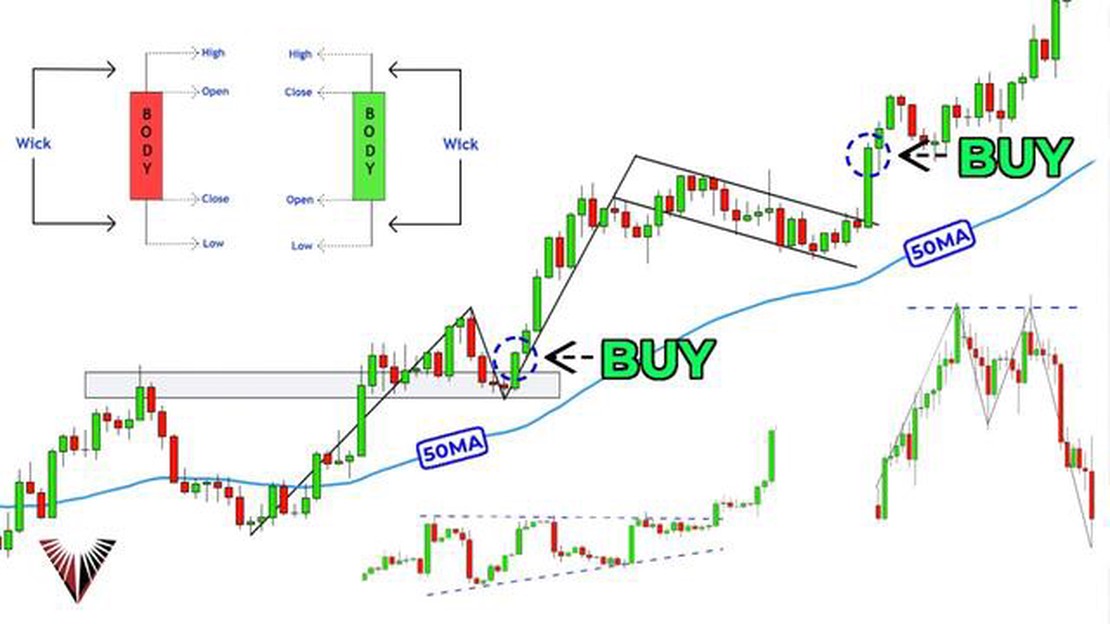
Charts: Forex traders use charts to visualize historical price data. The most common type of chart used is a candlestick chart, which displays the open, high, low, and close prices for each period of time. Traders look for patterns and trends in the charts to identify potential trading opportunities.
Indicators: Indicators are mathematical calculations that traders use to analyze price data and generate trading signals. There are numerous indicators available, such as moving averages, oscillators, and trend lines, each providing different insights into the market.
Support and resistance levels: Support and resistance levels are key levels on the chart that traders believe act as barriers to price movements. Support levels are price levels where buying pressure is believed to be strong enough to prevent the price from falling further, while resistance levels are price levels where selling pressure is believed to be strong enough to prevent the price from rising further. Traders look for price reactions at these levels to make trading decisions.
Read Also: Understanding the Tax Implications of Vested Shares in Australia
Pattern recognition: Technical analysts search for specific patterns in price charts that have historically indicated a potential trend reversal or continuation. Examples of common patterns include double tops and bottoms, head and shoulders, and triangles. By recognizing these patterns, traders can anticipate future price movements.
In conclusion, forex technical analysis is a valuable tool for traders to analyze currency price movements and make informed trading decisions. By studying historical price data, identifying patterns, and using various technical indicators, traders can gain insights into the market and potentially profit from their trades.
Forex technical analysis is a method used by traders to forecast future price movements based on historical price data. It involves the use of various tools and indicators to identify patterns, trends, and support and resistance levels in the market.
Traders who utilize technical analysis believe that past price movements can help predict future price movements. They analyze charts, graphs, and other data to identify patterns and trends that can provide insight into market direction.
One of the key concepts in forex technical analysis is the idea of support and resistance levels. Support levels are price levels at which the market has historically had difficulty falling below, indicating a potential buying opportunity. Resistance levels, on the other hand, are price levels at which the market has historically had difficulty rising above, indicating a potential selling opportunity.
Technical analysts also use various indicators, such as moving averages, oscillators, and trendlines, to make predictions about market behavior. Moving averages, for example, are used to smooth out price data and identify trend direction. Oscillators, on the other hand, help identify overbought and oversold conditions in the market.
Read Also: Exploring the Key Differences between Tam and TAS Trading | SiteName
Another important aspect of technical analysis is the use of chart patterns. Chart patterns, such as double tops, head and shoulders, and triangles, can indicate potential reversals or continuations in market trends. Traders look for these patterns to make trading decisions.
It’s worth noting that technical analysis is not foolproof and should be used in conjunction with other forms of analysis and risk management techniques. It is a tool that can help traders make more informed decisions, but it does not guarantee accurate predictions.
In conclusion, forex technical analysis is a method used by traders to analyze historical price data and forecast future price movements. It involves the use of various tools and indicators to identify patterns, trends, and support and resistance levels in the market. While it can be a useful tool, it should be used in conjunction with other forms of analysis and risk management techniques.

Forex technical analysis is a method of predicting price movement in the foreign exchange market based on historical price data and various technical indicators. It involves studying chart patterns, support and resistance levels, trend lines, and other tools to identify potential trading opportunities.
Forex technical analysis focuses solely on historical price data and chart patterns to predict future price movement. Fundamental analysis, on the other hand, considers economic indicators, news events, and other factors that can affect the value of a currency. Both types of analysis are used by traders to make informed trading decisions.
There are many technical indicators used in forex technical analysis, including moving averages, Relative Strength Index (RSI), Moving Average Convergence Divergence (MACD), Bollinger Bands, and Fibonacci retracement levels. Traders often combine multiple indicators to get a more comprehensive view of the market.
Yes, forex technical analysis can be used for both short-term and long-term trading. Short-term traders may use technical analysis to identify short-lived price patterns and capitalize on quick market movements, while long-term traders may use it to identify trends and significant support/resistance levels for their positions.
Forex technical analysis is widely used by traders and can be a valuable tool in predicting price movement. However, it should be used in conjunction with other forms of analysis and risk management techniques. While technical analysis can provide insights into market trends, it is not foolproof and cannot guarantee accurate predictions 100% of the time.
Forex technical analysis is the study of historical price data and chart patterns to predict future price movements in the foreign exchange market. It involves the use of various tools and indicators to identify trends, support and resistance levels, and potential entry and exit points for trades.
Technical analysis can help forex traders make informed trading decisions. By analyzing historical price data and market trends, traders can identify potential trading opportunities and predict future price movements. It can also help in setting stop-loss and take-profit levels and identifying potential entry and exit points for trades.

Understanding USD CNH: Definition, Features, and Significance The USD CNH currency pair refers to the exchange rate between the United States dollar …
Read Article
How to Solve a Glitch on Roblox Roblox is a popular online gaming platform that allows users to create and play games created by other users. While …
Read Article
What is the best background subtraction algorithm? Background subtraction is a fundamental process in computer vision that is used to separate …
Read Article
Exploring the Reasons Behind Gap Trading Market gaps occur when there is a significant difference between the closing price of a financial instrument …
Read Article
Reporting Forex on Taxes: A Comprehensive Guide When it comes to trading in the foreign exchange market, or forex, it’s important to understand the …
Read Article
Is it possible to make a living scalping forex? Forex trading is a highly competitive and volatile market, where traders aim to profit by taking …
Read Article


