


Understanding the Meaning of Hammer Candlestick Patterns: A Guide
Understanding the Meaning of a Hammer Candlestick Candlestick charts are widely used in technical analysis to identify potential market trends and …
Read Article
Interested in trading? Want to learn a reliable and popular trading strategy? Look no further than the MACD 2 Line Strategy. This comprehensive guide will teach you everything you need to know to start trading with the MACD indicator.
The MACD (Moving Average Convergence Divergence) is a widely-used technical analysis indicator that helps traders identify potential trend reversals, generate buy or sell signals, and establish entry and exit points for trades. By understanding and effectively utilizing the MACD 2 Line Strategy, you can improve your trading skills and increase your chances of success.
In this guide, you will learn:
“The MACD indicator is a powerful tool that can greatly enhance your trading performance. Whether you are a novice or experienced trader, this guide will provide you with the knowledge and skills necessary to effectively use the MACD 2 Line Strategy.”
Don’t miss out on this opportunity to gain a competitive edge in the trading world. Start learning the MACD 2 Line Strategy today and take your trading to the next level!
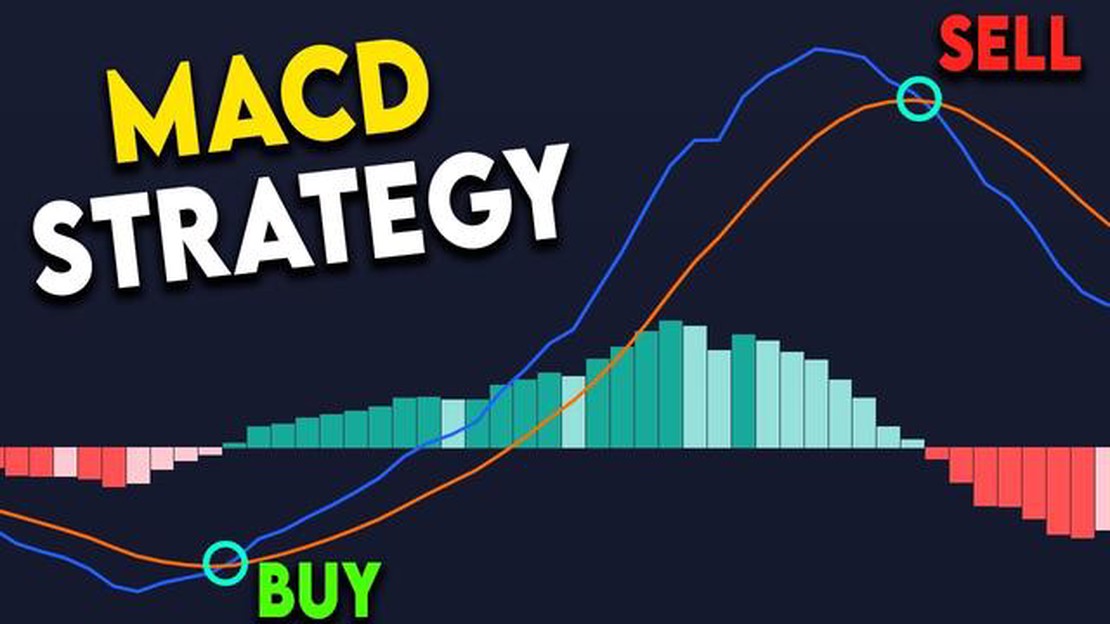
The MACD 2 Line Strategy is a popular trading strategy that utilizes the Moving Average Convergence Divergence (MACD) indicator to identify potential buy and sell signals. This strategy is based on two lines generated by the MACD indicator: the MACD line and the signal line.

The MACD line is calculated by subtracting the 26-period exponential moving average (EMA) from the 12-period EMA. It represents the difference between the shorter-term and longer-term moving averages. The signal line, on the other hand, is a 9-period EMA of the MACD line.
When using the MACD 2 Line Strategy, traders look for potential buy signals when the MACD line crosses above the signal line. This is considered a bullish signal and indicates that the trend may be shifting upwards. Conversely, traders look for potential sell signals when the MACD line crosses below the signal line. This is considered a bearish signal and indicates that the trend may be shifting downwards.
In addition to the MACD line and signal line crossings, traders also pay attention to the divergence between the MACD lines and the price action of the underlying asset. Divergence occurs when the MACD lines move in the opposite direction of the price. This can be a powerful signal of a potential trend reversal.
The MACD 2 Line Strategy can be applied to different timeframes and markets. Traders often use it in conjunction with other technical indicators and chart patterns to confirm signals and increase the probability of successful trades. However, like any trading strategy, it is important to use proper risk management and conduct thorough analysis before entering any trades.
The MACD 2 Line Strategy, also known as the Moving Average Convergence Divergence strategy, is a popular technical analysis tool used by traders to identify potential trading opportunities in the financial markets. It is based on the concept of convergence and divergence of two moving averages.
Read Also: Is Black-Scholes a binomial model? Exploring the relationship between the Black-Scholes pricing model and binomial models
The MACD consists of two lines: the MACD line and the signal line. The MACD line is calculated by subtracting the longer-term moving average from the shorter-term moving average. The signal line is a moving average of the MACD line itself.
The MACD 2 Line Strategy is typically used to generate buy and sell signals. When the MACD line crosses above the signal line, it generates a bullish signal, indicating that it may be a good time to enter a long position. Conversely, when the MACD line crosses below the signal line, it generates a bearish signal, indicating that it may be a good time to enter a short position.
Read Also: Do Forex Traders Need to Declare Their Trading Activities?
In addition to the crossover signals, traders also pay attention to the divergence of the MACD line and the price action. Divergence occurs when the price makes a new high or low, but the MACD does not confirm the movement. This can be a sign of a potential trend reversal or weakness in the current trend.
Traders can use various parameters for the MACD 2 Line Strategy, such as the length of the moving averages and the number of periods used to calculate the signal line. By adjusting these parameters, traders can fine-tune the strategy to suit their trading style and the specific financial instrument they are trading.
It is important to note that, like any trading strategy, the MACD 2 Line Strategy is not guaranteed to be 100% accurate. False signals can occur, and market conditions can change rapidly. Therefore, it is essential for traders to combine the use of the MACD strategy with other technical indicators and analysis methods to make informed trading decisions.
The MACD 2 Line strategy is a trading strategy that uses the Moving Average Convergence Divergence (MACD) indicator to identify buy and sell signals in the market. It involves plotting two lines on the MACD indicator: the MACD line and the signal line. When the MACD line crosses above the signal line, it generates a buy signal, and when the MACD line crosses below the signal line, it generates a sell signal.
The MACD 2 Line strategy works by analyzing the relationship between two lines on the MACD indicator: the MACD line and the signal line. When the MACD line crosses above the signal line, it indicates a potential buy signal, while a cross below the signal line indicates a potential sell signal. Traders can use these signals to enter and exit trades, with the goal of profiting from price movements in the market.

The best time frame for the MACD 2 Line strategy depends on the individual trader’s preferences and trading style. Some traders may prefer shorter time frames, such as 5 or 15 minutes, for day trading, while others may prefer longer time frames, such as 1 hour or daily charts, for swing trading or longer-term trading. It is important to test and experiment with different time frames to find the one that works best for your trading strategy.
Yes, the MACD 2 Line strategy can be used for all financial markets, including stocks, forex, commodities, and cryptocurrencies. The strategy is based on analyzing price movements and can be applied to any market that has a liquid and active price behavior. However, it is important to note that different markets may have different characteristics and dynamics, so it is advisable to adapt the strategy to the specific market you are trading.
While the MACD 2 Line strategy can be effective in identifying buy and sell signals in the market, it is not a foolproof strategy and has its limitations. For example, the strategy can generate false signals or give late signals in certain market conditions. Additionally, like any trading strategy, it requires discipline, risk management, and proper analysis to be successful. Traders should also be aware that no strategy can guarantee profits and that losses are possible.
The MACD 2 Line Strategy is a trading strategy that uses the MACD (Moving Average Convergence Divergence) indicator to identify potential buying and selling opportunities in the market. The strategy is based on the concept of convergence and divergence between two moving averages to provide signals for entry and exit points for trades.

Understanding the Meaning of a Hammer Candlestick Candlestick charts are widely used in technical analysis to identify potential market trends and …
Read Article
Understanding Xlt in Trading Xlt, short for Xtreme Learning Track, is a specialized educational program designed to help traders enhance their skills …
Read Article
What is the biggest trading platform in Australia? Are you looking for a reliable and reputable trading platform in Australia? Look no further! We are …
Read Article
Understanding the 60 Second Binary Trading Strategy Binary options trading has become increasingly popular in recent years, offering traders a …
Read Article
Unionbank Conversion Fee: How Much Does it Cost? When traveling internationally or conducting business with individuals and companies from different …
Read Article
What does the word UYU mean? The word UYU may seem unfamiliar to many, but it actually has a specific meaning and origin. In this article, we will …
Read Article


