

Does Japanese Candlestick Work? Analyzing the Effectiveness of this Trading Technique
Does Japanese candlestick work? The Japanese candlestick charting technique is a popular tool used by traders to analyze and predict future price …
Read Article
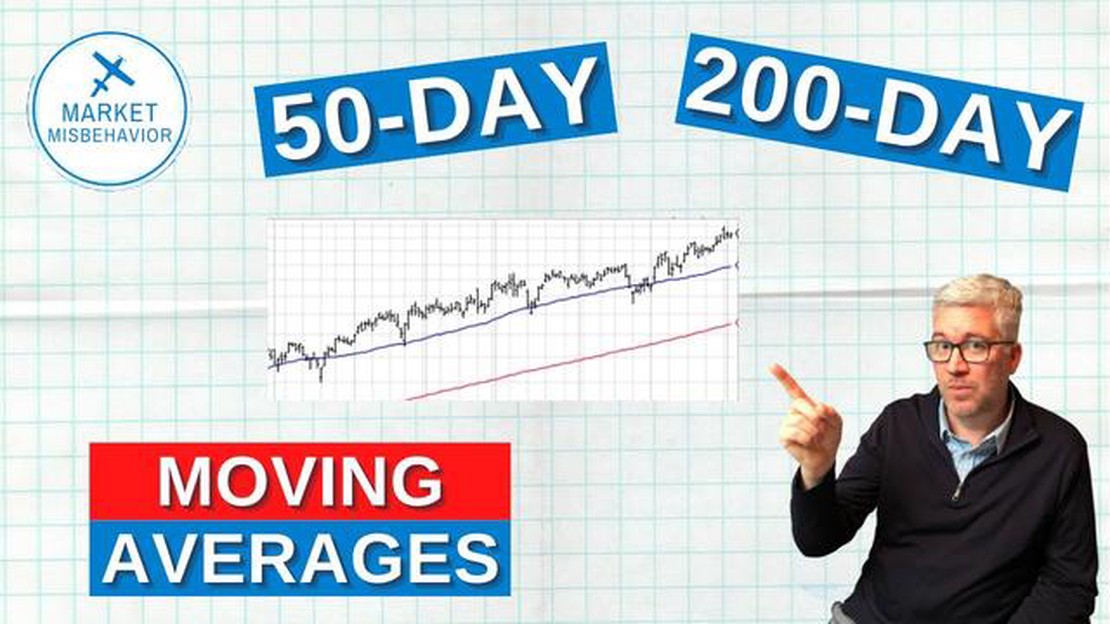
When it comes to analyzing stock market trends, moving averages are powerful tools that can provide valuable insights. Two commonly used moving averages are the 50-day moving average (MA) and the 200-day MA. These indicators are calculated by averaging the closing prices of a stock over a specific time period, and they help smooth out short-term fluctuations, allowing investors to identify long-term trends.
The 50-day MA represents the average price of a stock over the past 50 trading days, while the 200-day MA represents the average price over the past 200 trading days. By comparing these two moving averages, investors can gain a deeper understanding of the stock’s overall trend. When the 50-day MA falls below the 200-day MA, it is considered a bearish signal.
A 50-day MA below the 200-day MA indicates that the stock’s short-term performance is weaker than its long-term performance. This crossover is often regarded as a sign that the stock may continue to decline in the near future. It suggests that the stock’s momentum has shifted in a negative direction and that the bearish sentiment is gaining strength.
This bearish signal can have several implications for investors. It may indicate that the stock is in a downtrend or that it is losing its bullish momentum. Traders who use technical analysis often consider this crossover as a sell signal, indicating that it may be time to exit or reduce their positions in the stock. It can also prompt short-sellers to take action, as they speculate on further declines in the stock’s price.
However, it’s important to note that the significance of a 50-day MA below the 200-day MA may vary depending on other factors such as market conditions, company fundamentals, and investor sentiment. It is always advisable to conduct thorough research and consider multiple indicators before making any investment decisions based solely on this crossover. It should be used as a tool in a broader analysis to gain a better understanding of the overall market trend before making any trading or investment moves.
Moving averages are a key tool in financial analysis, used by traders and investors to make informed decisions in the stock market. These averages provide a way to smooth out fluctuations in price and identify trends over a given time period.
One of the most commonly used moving averages is the 50-day moving average. This average is calculated by taking the sum of the closing prices of a stock over the past 50 days, and then dividing that sum by 50. The 200-day moving average is calculated in a similar way, but considers the past 200 days.
The significance of a 50-day moving average below the 200-day moving average indicates a potential trend reversal in the stock. When the 50-day moving average falls below the 200-day moving average, it is often seen as a bearish signal. This suggests that the stock’s short-term performance is weaker than its long-term performance, and it may be a good time to sell or take a bearish position.
On the other hand, when the 50-day moving average is above the 200-day moving average, it is considered a bullish signal. This means that the stock’s short-term performance is stronger than its long-term performance, and it may be a good time to buy or take a bullish position.
Moving averages are not only used to identify trends and potential trend reversals, but they can also act as support and resistance levels for a stock. When the price of a stock is approaching its 50-day or 200-day moving average, it often encounters resistance or support, respectively. This can be a useful tool for traders to determine entry and exit points.

In conclusion, moving averages play a crucial role in financial analysis. They provide traders and investors with valuable insights into a stock’s performance and help them make informed decisions. Whether it’s identifying trends, determining entry and exit points, or signaling potential trend reversals, moving averages are an essential tool in every trader’s toolkit.
The 50-day moving average is a commonly used technical indicator in trading and investing. It is calculated by taking the average closing price of a security over the past 50 trading days. This moving average is often used to identify the short-term trend of a stock or index.
Read Also: Get your HDFC forex card within one day
Traders and investors use the 50-day moving average as a tool to determine whether a stock is in an uptrend or a downtrend. When the stock’s current price is above its 50-day moving average, it is considered to be in an uptrend. Conversely, when the price is below the 50-day moving average, it is in a downtrend.
The 50-day moving average is particularly useful for short-term traders who are looking to take advantage of short-term price movements. By identifying trends and using the 50-day moving average as a reference point, traders can make more informed trading decisions.
In addition to identifying trends, the 50-day moving average can also act as a support or resistance level. If a stock’s price falls towards the 50-day moving average during an uptrend, it often finds support and bounces back up. Conversely, if the price rises towards the 50-day moving average during a downtrend, it can act as a resistance level and push the price back down.
It’s important to note that the 50-day moving average should not be used as the sole indicator for making trading decisions. It is best used in conjunction with other technical indicators and analysis tools to confirm signals and generate more accurate trading strategies.
In conclusion, the 50-day moving average is a valuable tool for traders and investors. It helps identify short-term trends, acts as a support or resistance level, and can be used to make more informed trading decisions. By understanding and utilizing the 50-day moving average, traders can improve their chances of success in the market.
Calculating the 50-day moving average involves taking the average of the stock’s closing prices over the past 50 days. The closing price represents the final price at which a stock is traded on a given trading day.
To calculate the 50-day moving average, you would add together the closing prices of the stock over the past 50 trading days and then divide the sum by 50. This calculation is performed daily to update the moving average as each new day’s closing price is added and the oldest closing price is dropped from the calculation.
The formula for calculating the 50-day moving average can be summarized as follows:
Read Also: What Currency is Used in Sweden? Find Out Here
| Date | Closing Price |
|---|---|
| Day 1 | $50.00 |
| Day 2 | $50.50 |
| … | … |
| Day 50 | $55.00 |
In this example, you would calculate the 50-day moving average by adding up the closing prices for each day and dividing the sum by 50. Let’s say the total sum of the closing prices is $2,600. You would divide $2,600 by 50 to get an average of $52.00.

The 50-day moving average is a popular technical analysis tool that helps traders and investors identify trends and potential support or resistance levels in a stock’s price. It is often used in conjunction with other moving averages, such as the 200-day moving average, to provide a more comprehensive analysis of a stock’s price movements.
A moving average is a calculation that is used to analyze data points over a certain period of time to identify trends and patterns. It is commonly used in finance and investing to smooth out price fluctuations and provide a clearer picture of the overall trend.
When the 50-day moving average falls below the 200-day moving average, it is seen as a bearish signal by technical analysts. It suggests that the short-term trend is weaker than the long-term trend and may indicate a potential downtrend in the future. Traders and investors often use this crossover as a signal to sell or take a more cautious approach in their trading strategies.
Moving averages help in decision making by providing a visual representation of the overall trend. By smoothing out price fluctuations, they make it easier to identify whether the trend is moving upward, downward, or sideways. Traders and investors often use moving averages as a tool to determine entry and exit points, as well as to confirm the strength or weakness of a trend.
Yes, there are several different types of moving averages that traders and investors use, depending on their trading strategies and time frames. Some common types include the 20-day, 100-day, and 50-week moving averages. Each moving average calculates the average price over a different time period, which can provide different insights into the trend.
Traders and investors often use other technical indicators along with moving averages to get a more comprehensive analysis of the market. Some common indicators include the Relative Strength Index (RSI), MACD (Moving Average Convergence Divergence), and Bollinger Bands. These indicators can help confirm or further analyze the signals provided by moving averages.
A moving average is a calculation used to analyze data points by creating a series of averages of different subsets of the full data set.
The significance of a 50-day moving average below the 200-day moving average is that it may indicate a bearish trend in a stock or index. This is known as a “death cross” and is considered a negative signal for investors.

Does Japanese candlestick work? The Japanese candlestick charting technique is a popular tool used by traders to analyze and predict future price …
Read Article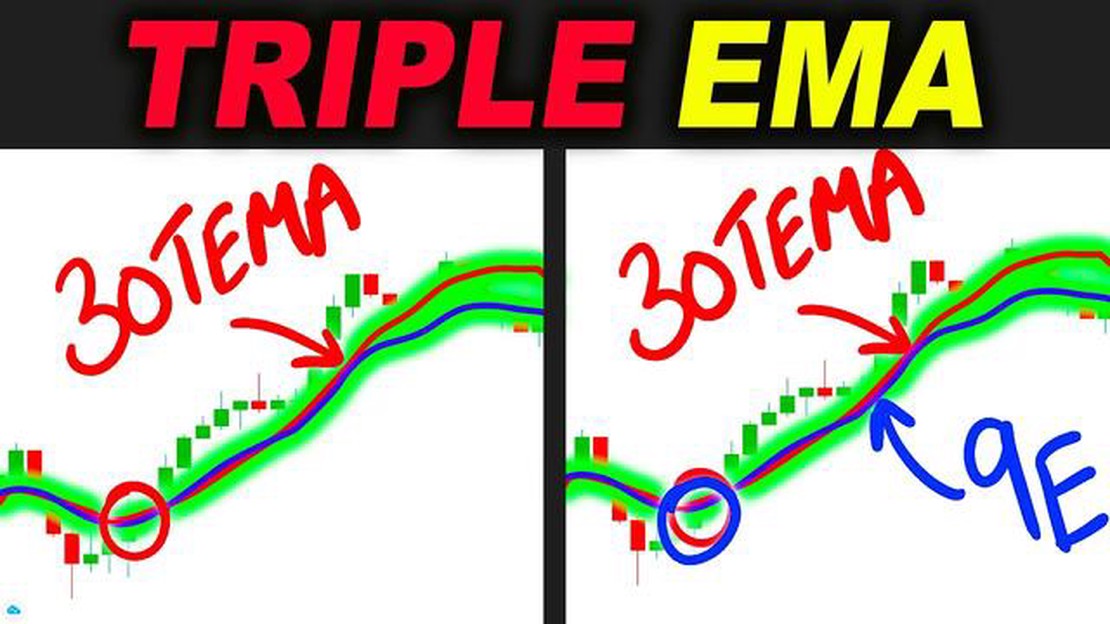
Understanding the Triple Exponential Moving Average in MT4 The Triple Exponential Moving Average (TEMA) is a technical indicator used in trading to …
Read Article
CHF Prediction for 2023: Analyzing the Future Outlook The Swiss Franc (CHF) has long been regarded as a safe haven currency, known for its stability …
Read Article
Understanding the Exchange Policy: A Step-by-Step Guide When making purchases, it’s important to have a clear understanding of the exchange policy. …
Read Article
Understanding the 1-Year T-Bill Rate: Everything You Need to Know The Treasury bill (T bill) is a short-term debt security issued by the United States …
Read Article
RBI Guidelines for Risk Management The Reserve Bank of India (RBI) is the central banking institution of India and plays a crucial role in maintaining …
Read Article


