

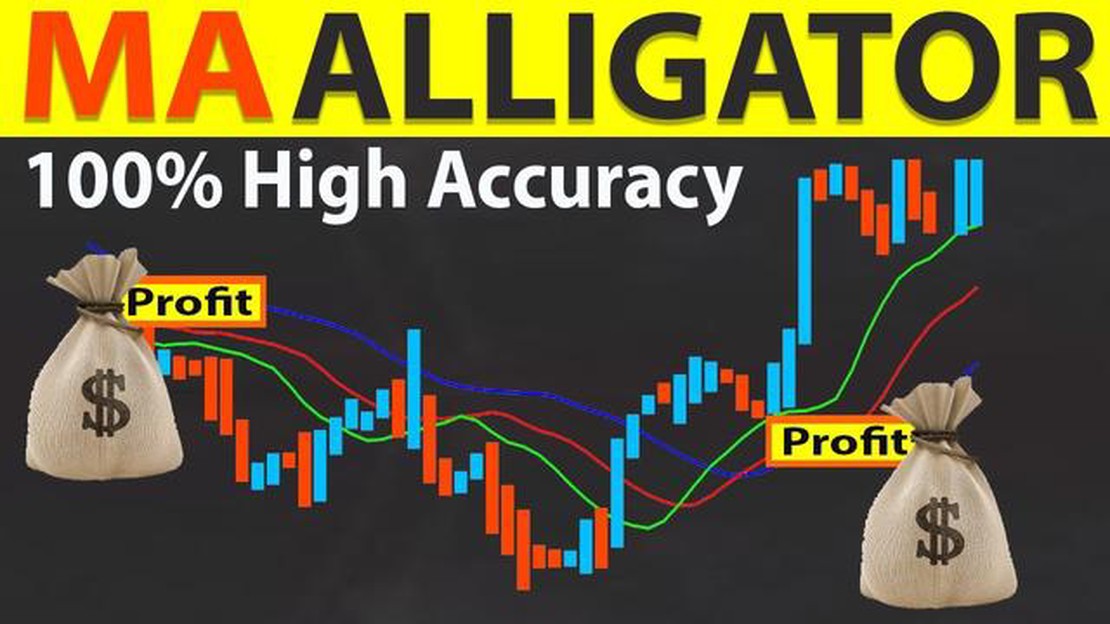

How Accurate is the Alligator Strategy? Discover its Effectiveness
Is the Alligator strategy really accurate? The Alligator Strategy is a popular trading approach that aims to identify trending markets and capture …
Read Article
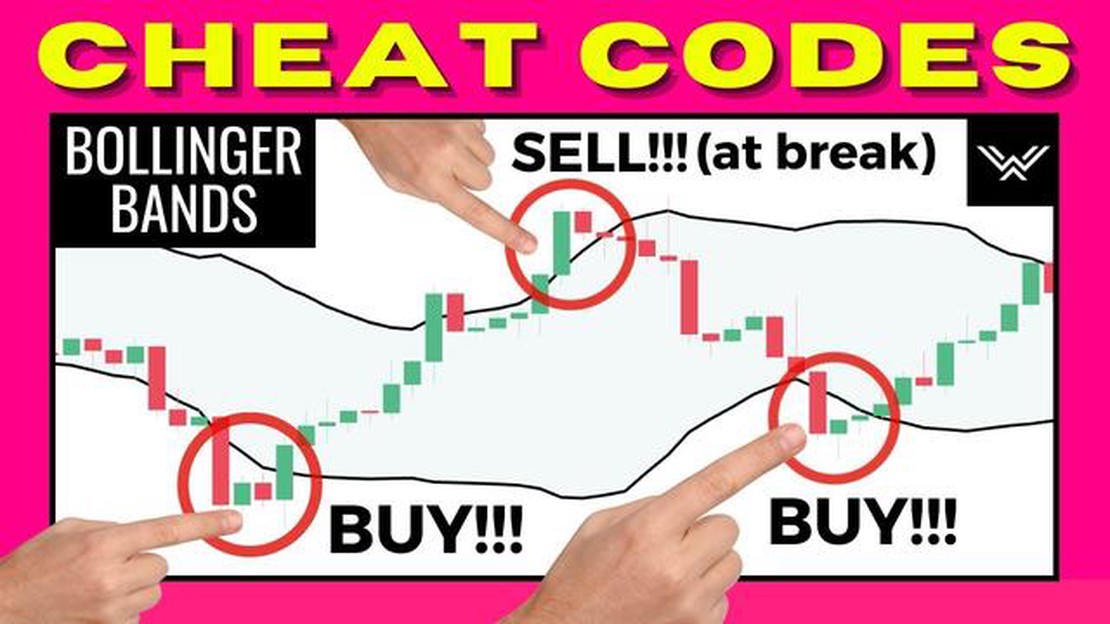
When it comes to technical analysis in financial markets, Bollinger Bands are a widely used tool. Developed by John Bollinger in the 1980s, Bollinger Bands are a volatility indicator that helps traders identify potential price reversals and trend continuations.
The concept behind Bollinger Bands is relatively simple. They consist of three lines: the middle band, which is a moving average; the upper band, which is the standard deviation of the middle band; and the lower band, which is also the standard deviation of the middle band. These bands dynamically adjust to market conditions, expanding when volatility increases and contracting when volatility decreases.
Traders use Bollinger Bands to identify overbought and oversold conditions in a market. When the price touches or crosses the upper band, it is considered overbought, suggesting a potential reversal or pullback. Conversely, when the price touches or crosses the lower band, it is considered oversold, indicating a possible bounce or reversal in the opposite direction.
However, Bollinger Bands are not limited to identifying overbought and oversold conditions. They can also be used to analyze the strength of a trend. When the price consistently stays close to the upper band, it suggests a strong uptrend, while a price that consistently stays near the lower band indicates a strong downtrend. Traders can use this information to make informed decisions about entering or exiting trades.
It is important to note that Bollinger Bands should be used in conjunction with other technical indicators and analysis tools. They are not foolproof and can produce false signals, especially in trending markets. Additionally, Bollinger Bands provide a historical perspective of price action, so they may not accurately reflect current market conditions.
Overall, understanding and implementing the rule of Bollinger Bands can be a valuable asset for traders. By combining them with other technical tools and market knowledge, traders can gain insights into potential price reversals and trend continuations, enhancing their trading strategies and decision-making process.
Bollinger Bands are a popular technical analysis tool that is used to measure the volatility of a financial instrument, such as a stock, commodity, or currency pair. Developed by John Bollinger in the 1980s, Bollinger Bands consist of a simple moving average (SMA) line in the center, surrounded by two standard deviation lines above and below the SMA.
The SMA line represents the average price over a specified period of time, usually 20 days. The standard deviation lines are calculated based on the volatility of the price movement, and they provide a measure of how far away the price is from the SMA.
Bollinger Bands are typically plotted on a price chart, and they expand and contract based on the volatility of the underlying asset. When the price is moving within the bands, it is considered to be in a normal range. However, when the price breaks above or below the bands, it is seen as a sign of increased volatility and potential trading opportunities.
| Upper Band | The upper band is calculated by adding two standard deviations to the SMA line. It represents a level where the price is considered overbought. |
| Lower Band | The lower band is calculated by subtracting two standard deviations from the SMA line. It represents a level where the price is considered oversold. |
| Band Width | The band width is a measure of volatility and is calculated by taking the difference between the upper and lower bands. A wider band width indicates higher volatility, while a narrower band width indicates lower volatility. |
Read Also: Everything you should know about binary options - a comprehensive guide
Bollinger Bands can be used in various ways by traders. Some common strategies include identifying overbought and oversold conditions, spotting trend reversals, and generating buy or sell signals based on price breakouts.
It’s important to note that Bollinger Bands are not meant to be used in isolation, but rather in combination with other technical indicators and analysis techniques. Traders should always consider the overall market conditions and use additional tools to confirm their trading decisions.
Bollinger Bands are a popular technical analysis tool used by traders to identify potential price reversals and gauge market volatility. Developed by John Bollinger in the 1980s, these bands consist of three lines: a middle line representing a moving average, and an upper and lower line that are standard deviations away from the middle line. The purpose of Bollinger Bands is to provide a visual representation of price volatility and to help traders identify overbought and oversold conditions in the market.
The middle line, or the moving average, is typically set at 20 periods, but traders can adjust this value based on their preference and the time frame they are analyzing. The upper and lower lines are usually set two standard deviations away from the moving average, which creates a “channel” around the price. When the price reaches the upper band, it is considered overbought, and when it reaches the lower band, it is considered oversold. Traders can use these signals to anticipate potential price reversals or to confirm existing trends.
Read Also: Learn How to Add a World Clock to Your Desktop on Windows 7
Bollinger Bands can be applied to various financial instruments, including stocks, commodities, and currencies. Traders can use this tool in conjunction with other technical indicators or on its own to make informed trading decisions. By understanding and interpreting the information provided by Bollinger Bands, traders can potentially increase their profitability and minimize risk in the market.
It is important to note that Bollinger Bands are not a standalone trading strategy but rather a tool that can be used in conjunction with other analysis techniques to make informed decisions. It is recommended to combine Bollinger Bands with other indicators, such as oscillators or volume analysis, to receive more accurate signals and to mitigate the risk of false signals.
In summary, Bollinger Bands provide traders with a visual representation of volatility and can be used to identify potential price reversals and overbought/oversold conditions. By understanding how to interpret the information provided by Bollinger Bands, traders can improve their trading decisions and increase their chances of success in the market.
Bollinger Bands are a technical analysis tool that helps traders identify potential price reversals and determine the volatility of a financial instrument.
Bollinger Bands consist of a middle band, which is a simple moving average, and an upper and lower band that represent the standard deviations from the middle band. These bands expand and contract based on the volatility of the financial instrument being analyzed.

The purpose of Bollinger Bands is to provide traders with a visual representation of the volatility of a financial instrument. They can be used to identify potential price reversals and to determine the strength of a trend.
Traders can use Bollinger Bands to identify overbought or oversold conditions in a market. When the price touches the upper band, it may be a signal that the price is overbought and could reverse lower. Conversely, when the price touches the lower band, it may be a signal that the price is oversold and could reverse higher.
Bollinger Bands can be a helpful tool in predicting potential price movements, but they are not foolproof. Traders should use other technical analysis tools and indicators in conjunction with Bollinger Bands to get a more comprehensive view of the market.
Bollinger Bands are a technical analysis tool developed by John Bollinger. They consist of a middle band, which is a moving average, and an upper and lower band that are standard deviations away from the middle band.

Is the Alligator strategy really accurate? The Alligator Strategy is a popular trading approach that aims to identify trending markets and capture …
Read Article
Where to Buy USD in Sydney: A Step-by-Step Guide Are you planning a trip to the United States and need to buy USD? This comprehensive guide will …
Read Article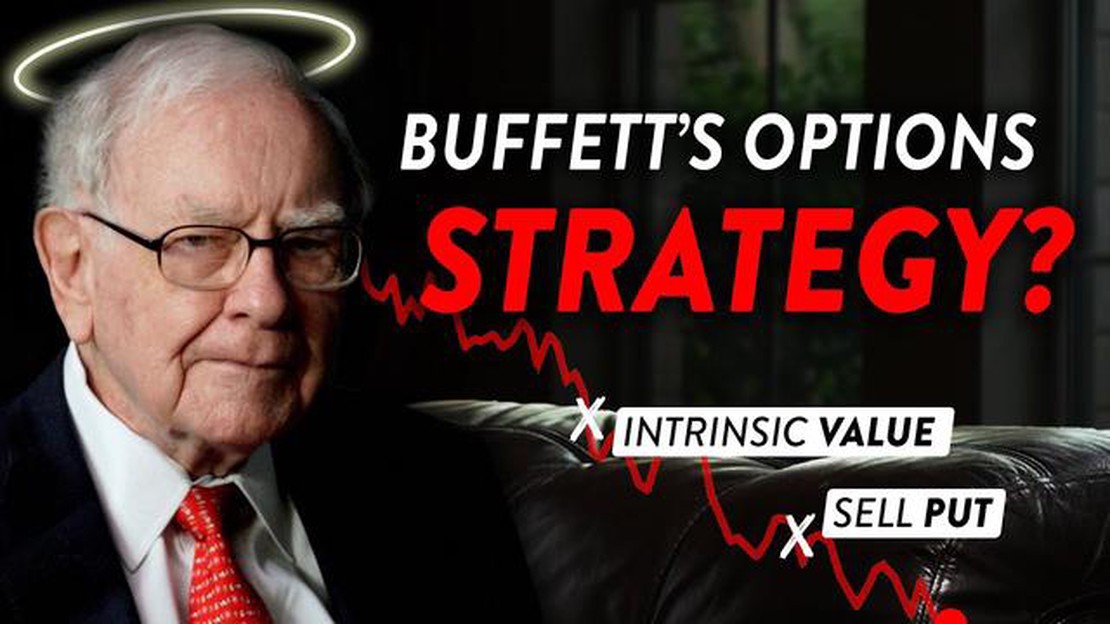
Warren Buffett’s Options Trading Strategy: Insights and Analysis Warren Buffett, widely regarded as one of the most successful investors of all time, …
Read Article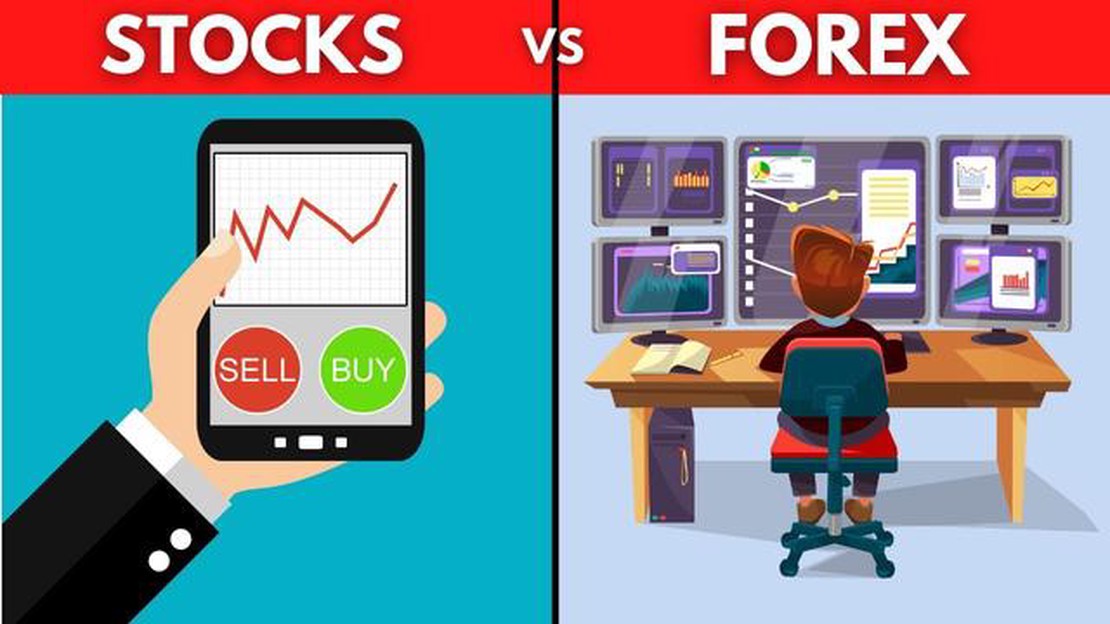
Forex vs Foreign Exchange: Understanding the Difference In the world of finance, the terms “Forex” and “Foreign Exchange” are often used …
Read Article
Effective Strategies for Advertising Binary Options In an increasingly competitive market, advertising binary options requires a strategic approach. …
Read Article
Is affiliate marketing still profitable in 2023? Affiliate marketing has been a popular way for individuals and businesses to earn passive income for …
Read Article


