


Understanding the Assorted Signals in Forex Trading: A Comprehensive Guide
How many signals are there in forex trading? Forex trading is a complex and volatile market that requires a deep understanding of various signals and …
Read Article
When it comes to technical analysis, traders often rely on various indicators to help them make informed decisions. One such indicator is the Bollinger Band Bandwidth Indicator. This powerful tool is used to measure the volatility of a financial instrument and can provide valuable insights into potential price movements.
The Bollinger Band Bandwidth Indicator is derived from the popular Bollinger Bands, which were developed by John Bollinger. Bollinger Bands consist of three lines: a simple moving average in the middle, and an upper and lower band that represent two standard deviations from the moving average. These bands expand and contract based on the volatility of the market.
The Bandwidth Indicator, on the other hand, measures the width between the upper and lower Bollinger Bands. It represents the percentage difference between the two bands and provides traders with a visual representation of volatility. When the bandwidth is narrow, it indicates low volatility, while a wide bandwidth suggests high volatility.
Traders can use the Bollinger Band Bandwidth Indicator in a variety of ways. For instance, a narrowing bandwidth can serve as a signal for an impending breakout or a period of consolidation. Conversely, a widening bandwidth can indicate an increase in volatility and the potential for larger price swings. By understanding and interpreting the Bandwidth Indicator, traders can gain a deeper understanding of market dynamics and make more informed trading decisions.
In conclusion, the Bollinger Band Bandwidth Indicator is a powerful tool that can help traders gauge the volatility of a financial instrument. By measuring the width between the upper and lower Bollinger Bands, this indicator provides valuable insights into potential price movements. Whether used to identify periods of consolidation or anticipate breakouts, the Bandwidth Indicator can be a valuable addition to any trader’s toolkit. When combined with other technical analysis tools and market knowledge, it can enhance trading strategies and improve overall profitability.
The Bollinger Band Bandwidth Indicator measures the width between the upper and lower Bollinger Bands. This width is a measure of volatility, with a narrower width indicating low volatility and a wider width indicating high volatility. The Bandwidth Indicator can be used to identify periods of low volatility, which often precede periods of high volatility and potential trading opportunities.
Traders commonly use the Bollinger Band Bandwidth Indicator in conjunction with other technical indicators and price action analysis to make trading decisions. When the Bandwidth Indicator is low, it can signal a period of consolidation or range-bound trading, indicating the potential for a breakout or significant price move in the future. Conversely, when the Bandwidth Indicator is high, it can indicate increased volatility and the potential for a reversal or trend continuation.
The Bollinger Band Bandwidth Indicator can be calculated using various methods, but the most common formula is:
Bandwidth = (Upper Band - Lower Band) / Middle Band * 100
Traders can adjust the parameters of the Bollinger Bands, such as the period and standard deviation, to suit their trading style and the market they are analyzing. It is important to note that the Bandwidth Indicator is not a standalone trading strategy, but rather a tool that can complement other analysis techniques.
In summary, the Bollinger Band Bandwidth Indicator is a valuable tool for traders to analyze volatility and identify potential trading opportunities. By measuring the width between the Bollinger Bands, it provides insights into the market’s current volatility levels and can help traders make more informed decisions.

The Bollinger Band Bandwidth Indicator is a measure of volatility that is derived from the Bollinger Bands. It provides traders with valuable insights into the volatility of a security or market.
To calculate the Bollinger Band Bandwidth Indicator, you need to first calculate the Bollinger Bands. The Bollinger Bands consist of a middle band, which is a simple moving average (SMA) of the closing prices, an upper band, which is the middle band plus two standard deviations, and a lower band, which is the middle band minus two standard deviations.
Once you have calculated the Bollinger Bands, you can then calculate the Bollinger Band Bandwidth Indicator using the following formula:
Bandwidth = (Upper Band - Lower Band) / Middle Band
This formula calculates the percentage difference between the upper and lower bands, relative to the middle band. The resulting value represents the volatility of the security or market.
For example, let’s say the upper band is at 100, the lower band is at 80, and the middle band is at 90. Using the formula above, we can calculate the bandwidth as follows:
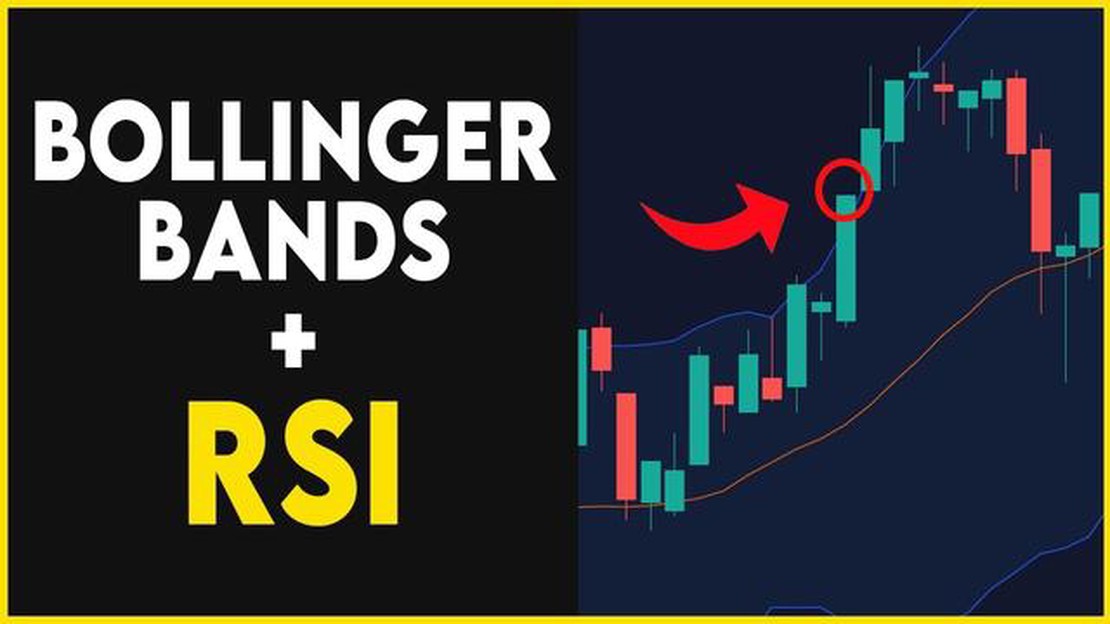
Read Also: Using RSI with Bollinger Bands: A Comprehensive Guide
Bandwidth = (100 - 80) / 90
Bandwidth = 0.2222
Read Also: Best Ways to Exchange Foreign Currency in NYC | Your Ultimate Guide
This means that the Bollinger Band Bandwidth Indicator for this security or market is 0.2222, or 22.22%.
Traders use the Bollinger Band Bandwidth Indicator to identify periods of low volatility, which may indicate a potential breakout, and periods of high volatility, which may indicate a potential trend reversal or continuation.
By understanding how to calculate and interpret the Bollinger Band Bandwidth Indicator, traders can make more informed trading decisions and improve their overall profitability.
The Bollinger Band Bandwidth Indicator is a powerful tool used to measure the volatility of a security. It is derived from the Bollinger Bands, which are a popular technical analysis tool created by John Bollinger.
The Bandwidth Indicator is calculated by dividing the difference between the upper and lower Bollinger Bands by the middle band, which is typically a simple moving average. The result is expressed as a percentage and represents the width of the Bollinger Bands relative to the middle band.
A high Bandwidth reading indicates that the Bollinger Bands are expanding, suggesting increased market volatility. Conversely, a low Bandwidth reading suggests that the Bollinger Bands are contracting, indicating decreased volatility.

Traders use the Bollinger Band Bandwidth Indicator in various ways. One common approach is to use it as a confirmation tool for other technical analysis indicators. For example, if a stock is in an uptrend and the Bandwidth indicator starts to rise, it could be seen as a confirmation that the uptrend is gaining strength.
Another way to interpret the Bandwidth Indicator is by looking for volatility squeezes. These occur when the Bollinger Bands contract to an unusually narrow level. Traders often view this as a sign that a period of low volatility is about to end and that a significant price move could be imminent. They may use this information to plan for potential breakouts or reversals.
It’s important to note that the Bollinger Band Bandwidth Indicator is not a stand-alone tool and should be used in conjunction with other analysis methods. It is also crucial to consider the overall market conditions and fundamental factors that could impact the security being analyzed.
In conclusion, the Bollinger Band Bandwidth Indicator is a valuable tool for assessing market volatility. By understanding and interpreting its readings, traders can gain insights into potential trading opportunities and make more informed decisions.
The Bollinger Band Bandwidth indicator is a technical analysis tool that measures the width between the upper and lower Bollinger Bands.
The Bollinger Band Bandwidth is calculated by dividing the difference between the upper and lower Bollinger Bands by the middle band.
A low Bollinger Band Bandwidth indicates a period of low volatility in the market.
The Bollinger Band Bandwidth can be used as an indicator of market volatility, but it should not be solely relied upon to predict market trends.
The Bollinger Band Bandwidth indicator can be used to identify periods of low volatility, which may be followed by periods of high volatility. Traders can use this information to adjust their trading strategies accordingly.

How many signals are there in forex trading? Forex trading is a complex and volatile market that requires a deep understanding of various signals and …
Read Article
Advantages of Using FPGA over ASIC In the world of digital circuits, engineers have two main options when it comes to designing custom integrated …
Read Article
Is forex trading legal in Qatar? Forex trading, also known as foreign exchange trading, is a popular investment option for many people around the …
Read Article
Best Rates at Barclays Bank Are you looking for the best interest rates for your savings? Look no further than Barclays Bank! With a long-standing …
Read Article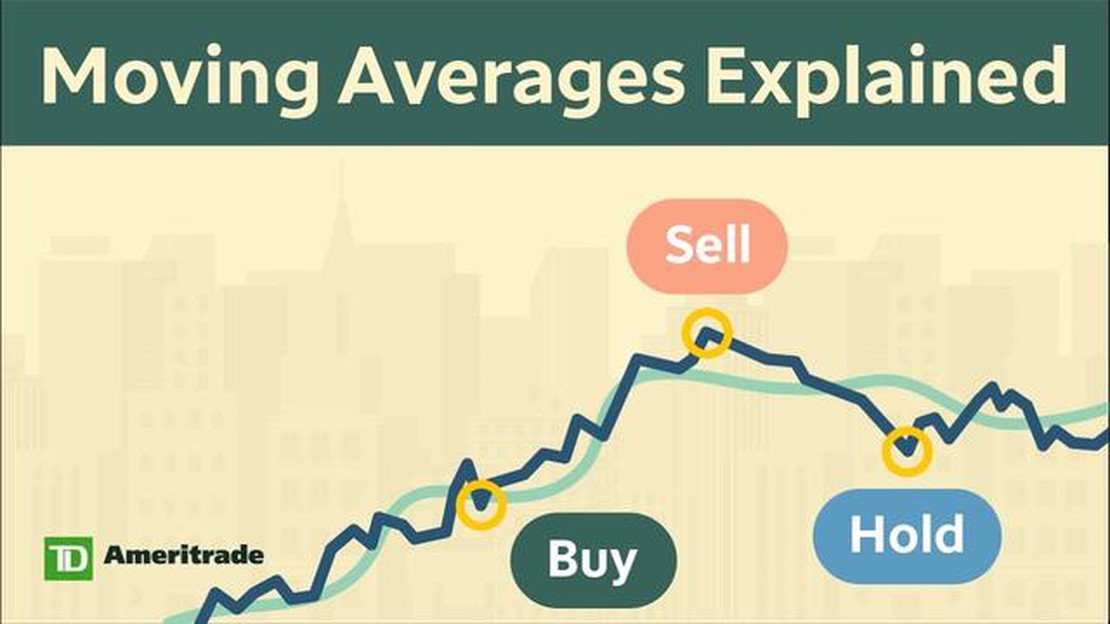
Understanding the Significance of the 20-Day Moving Average Crossing the 50-Day Moving Average The movement of stock prices is a key concern for …
Read Article
Can you sell options before market opens? Options are a popular financial instrument used by investors to hedge risk or speculate on the price …
Read Article


