


What is the official name of the forex market in India?
Discover the Name of the Indian Forex Market The forex market in India is officially known as the Foreign Exchange Market. It is a decentralized …
Read Article
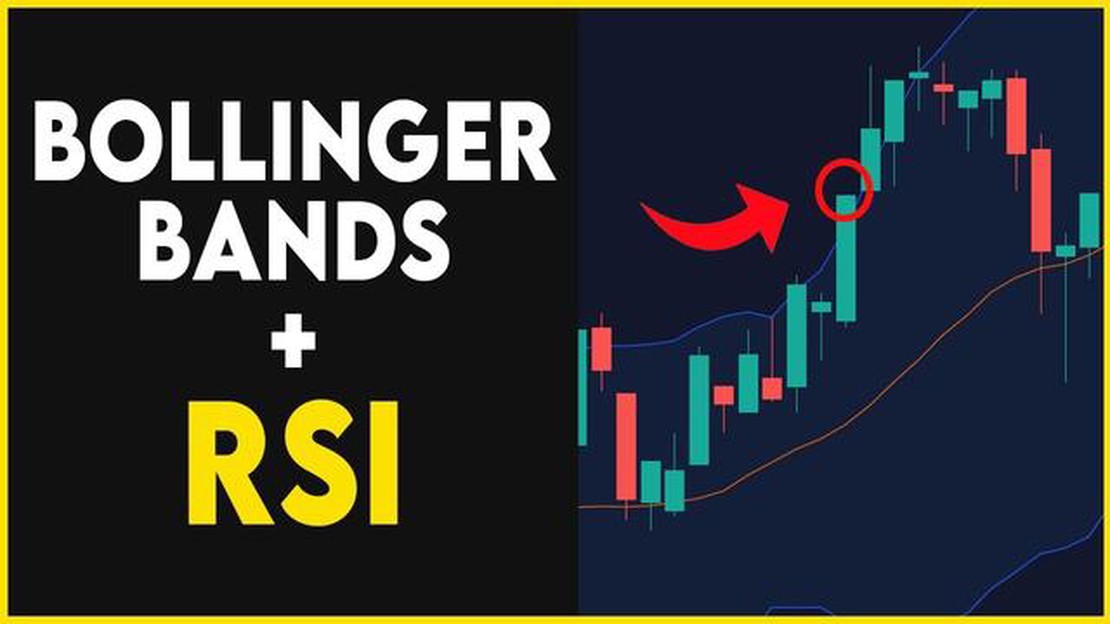
The Relative Strength Index (RSI) and Bollinger Bands are two popular technical indicators used by traders to analyze and forecast market trends. While each indicator can offer valuable insights on its own, combining them can provide even more powerful signals.
RSI is a momentum oscillator that measures the speed and change of price movements. It oscillates between 0 and 100 and is typically used to identify overbought and oversold conditions in the market. Bollinger Bands, on the other hand, are a volatility indicator that consists of a moving average and two bands plotted above and below the average. They help to identify price levels at which the market is likely to experience a significant move.
By using RSI in combination with Bollinger Bands, traders can gain a better understanding of market conditions and make more informed trading decisions. For example, when the RSI is above a certain threshold, such as 70, and the price is touching the upper Bollinger Band, it may indicate that the market is overbought and due for a correction. Conversely, when the RSI is below a threshold, such as 30, and the price is touching the lower Bollinger Band, it may suggest that the market is oversold and due for a reversal.
It’s important to note that using RSI with Bollinger Bands is not a foolproof strategy and should be used in conjunction with other analysis techniques and risk management tools. Traders should also be aware that market conditions can change rapidly, and it’s essential to adapt one’s strategy accordingly. Additionally, backtesting and thorough analysis of historical data can help validate the effectiveness of this combined approach.
In conclusion, combining RSI with Bollinger Bands can enhance a trader’s ability to identify potential trading opportunities and manage risk. By understanding the signals generated by these two indicators, traders can make more informed decisions and increase their chances of success in the market.

The Relative Strength Index (RSI) and Bollinger Bands are two popular technical indicators used in technical analysis to analyze and predict price movements in financial markets. These indicators can be used individually or in combination to provide valuable insights into market trends and potential trading opportunities.
The RSI is a momentum oscillator that measures the speed and change of price movements. It oscillates between 0 and 100 and is typically displayed as a line graph. A reading above 70 indicates an overbought condition, while a reading below 30 indicates an oversold condition. Traders often use these levels as signals for potential reversals in price.
On the other hand, Bollinger Bands consist of a simple moving average (SMA) and two standard deviation channels above and below the SMA. The upper and lower bands represent the expected range of price fluctuations based on historical data. When the price moves towards the upper band, it may indicate an overbought condition, while a move towards the lower band may indicate an oversold condition.
By combining the RSI and Bollinger Bands, traders can get a more comprehensive view of market conditions. For example, if the RSI is indicating an overbought condition (above 70) and the price is approaching the upper Bollinger Band, it may provide a stronger signal to sell or short the asset. Conversely, if the RSI is indicating an oversold condition (below 30) and the price is nearing the lower Bollinger Band, it may signal a potential buying opportunity.
It’s important to note that these indicators should not be used in isolation, but rather as part of a broader trading strategy. They are most effective when used in conjunction with other technical and fundamental analysis tools, as well as risk management techniques. Traders should also consider the specific market conditions and the time frame they are trading in when interpreting these signals.
Read Also: How Many Indicators Are There in MT4? Discover the Extensive Range of Technical Analysis Tools
In conclusion, understanding and utilizing the RSI and Bollinger Bands can provide traders with valuable insights into market trends and potential trading opportunities. By combining these indicators, traders can enhance their decision-making process and increase their chances of success in the financial markets.
The Relative Strength Index (RSI) is a popular technical indicator that is used to measure the speed and change of price movements. It is often used in combination with other indicators, such as Bollinger Bands, to provide a comprehensive analysis of a security’s price action.
Bollinger Bands are volatility bands that are placed above and below a moving average. They are used to identify potential reversal points, as well as to provide an indication of whether a security is overbought or oversold.
When using RSI with Bollinger Bands, traders can gain a clearer understanding of a security’s price movement and potential reversals. The RSI can confirm or contradict the signals given by Bollinger Bands, providing additional insight into the strength of a trend.
Read Also: How to Use the Moving Averages Method for Effective Analysis
For example, if a security is approaching the upper Bollinger Band and the RSI is also indicating that it is overbought, this can be seen as a strong sell signal. Conversely, if a security is approaching the lower Bollinger Band and the RSI is indicating that it is oversold, this can be seen as a strong buy signal.
It is important to note that using RSI with Bollinger Bands is not a guaranteed method for predicting price movements. It is just one tool in a trader’s toolbox and should be used in conjunction with other indicators and analysis techniques.
Overall, by using RSI with Bollinger Bands, traders can gain a more comprehensive understanding of a security’s price action and potential reversals. This can help them make more informed trading decisions and improve their overall profitability.
RSI (Relative Strength Index) is a technical indicator used in trading to measure the strength and speed of price movements. It oscillates between 0 and 100 and is typically plotted as a line graph. RSI compares the magnitude of recent gains to recent losses in order to determine overbought or oversold conditions in the market.
Bollinger Bands are a popular technical analysis tool created by John Bollinger. They consist of three lines: a simple moving average (SMA) in the middle, an upper band and a lower band. The upper and lower bands are calculated based on the standard deviation of price from the SMA. Traders use Bollinger Bands to identify periods of high or low volatility and to signal potential reversal or continuation of a trend.

RSI and Bollinger Bands can be used together to provide more reliable trading signals. When the price is near the upper Bollinger Band and the RSI is in overbought territory (above 70), it can indicate a potential price reversal. Conversely, when the price is near the lower Bollinger Band and the RSI is in oversold territory (below 30), it can indicate a potential price rebound. Traders can also look for bullish or bearish divergences between the RSI and price to confirm or invalidate a trading signal.
One limitation is that RSI and Bollinger Bands are lagging indicators, meaning they use past price data to provide signals. This can result in delayed or missed opportunities. Additionally, false signals can occur, especially in trending markets where the price can stay overbought or oversold for extended periods of time. It’s important for traders to use other technical analysis tools and consider the overall market context when using RSI with Bollinger Bands.
Yes, there are several alternative indicators that can be used with Bollinger Bands. Some popular options include the MACD (Moving Average Convergence Divergence), the Stochastic Oscillator, and the RSI Divergence. These indicators can provide additional confirmation or divergence signals when used in conjunction with Bollinger Bands.
RSI (Relative Strength Index) is a technical indicator used in technical analysis to measure the momentum of price movements. Bollinger Bands is another technical indicator that measures the volatility of price movements.

Discover the Name of the Indian Forex Market The forex market in India is officially known as the Foreign Exchange Market. It is a decentralized …
Read Article
Stock Taxes in Canada: Everything You Need to Know When it comes to investing in stocks, it is important for Canadians to understand the tax …
Read Article
Is options trading available in USA? Options trading has become increasingly popular in recent years, providing investors with the opportunity to …
Read Article
Understanding TDI in Forex Trading In the world of forex trading, traders are constantly on the lookout for tools and indicators that can help them …
Read Article
Is Leverage Permissible in Islam? Understanding the Islamic Perspective on Financial Leverage In Islam, the concept of leverage is a topic of …
Read Article
Is MQL5 MetaTrader 5? When it comes to trading in the financial markets, having access to the right tools and platforms is crucial. Two popular …
Read Article

