


Examples of Accumulators: Explore Different Types of Accumulators
Examples of Accumulators: Understanding the Concept and Its Applications An accumulator is a device or mechanism used to store and accumulate energy …
Read Article

When it comes to analyzing the stock market, there are numerous indicators and tools that traders and investors use to gain insights into market trends. One such indicator that has gained significant popularity is the 20 EMA (Exponential Moving Average).
The 20 EMA is a technical analysis tool that is used to identify the overall trend of a stock. It is calculated by taking the average closing price of a stock over the past 20 trading days, giving more weight to recent prices. This moving average line is then plotted on a stock chart, providing traders with a visual representation of the stock’s price action over time.
The 20 EMA is particularly useful because it acts as a support or resistance level for the stock. When the price of a stock is above the 20 EMA, it is considered to be in an uptrend, and the 20 EMA acts as a support level, providing buying opportunities for traders. On the other hand, when the price is below the 20 EMA, it is considered to be in a downtrend, and the 20 EMA acts as a resistance level, providing selling opportunities for traders.
In addition to identifying trends and support/resistance levels, the 20 EMA can also be used to generate trading signals. For example, when the price of a stock crosses above the 20 EMA, it is considered a bullish signal, indicating a potential buying opportunity. Conversely, when the price crosses below the 20 EMA, it is considered a bearish signal, indicating a potential selling opportunity.
It’s important to note that no single indicator can guarantee profitable trades, and traders should always use the 20 EMA in conjunction with other technical analysis tools and indicators to make informed decisions.
In conclusion, the 20 EMA is a powerful tool in the hands of traders and investors. It helps identify trends, support/resistance levels, and generates trading signals, allowing market participants to make more informed decisions. However, it is important to remember that trading in the stock market involves risk, and understanding the role of indicators like the 20 EMA is just one piece of the puzzle in successful trading.

The 20 EMA (Exponential Moving Average) Indicator is a technical analysis tool commonly used in the share market to identify trends and potential trading opportunities. It is derived from the mathematical calculation of the average price of a security over a specific period, with more weight given to recent price data.
The 20 EMA Indicator is calculated using the closing prices of a security over a 20-day period, although the number of days can be adjusted to suit individual preferences or trading strategies. The indicator smooths out price fluctuations and provides traders with a visual representation of the overall trend.
The EMA calculation differs from the simple moving average (SMA) in that it puts more weight on recent price data. This means that the 20 EMA Indicator reacts more quickly to changes in price, allowing traders to identify potential trend reversals or breakouts sooner.
Traders use the 20 EMA Indicator in various ways. One common approach is to use it as a trend-following tool. When the price is above the 20 EMA, it is considered a bullish signal, indicating an uptrend. Conversely, when the price is below the 20 EMA, it is considered a bearish signal, indicating a downtrend.
Another way to use the 20 EMA Indicator is to identify potential entry and exit points for trades. Traders may look for price crosses above or below the 20 EMA as a signal to enter or exit a position. Additionally, the 20 EMA can act as a dynamic support or resistance level, with the price often bouncing off it.
Read Also: How is FX forward settled? A comprehensive guide to settlement in FX forward transactions
It is important to note that the 20 EMA Indicator is just one tool in a trader’s arsenal and should not be relied upon solely for making trading decisions. It is best used in conjunction with other indicators and analysis techniques to confirm trading signals and increase the probability of successful trades.
| Advantages | Disadvantages |
|---|---|
| - Provides a clear visual representation of the trend | - Can generate false signals in choppy or sideways markets |
| - Reacts quickly to changes in price | - May lag behind during strong trends |
| - Can be used as a support or resistance level | - Should not be used as the sole basis for trading decisions |
The Exponential Moving Average (EMA) is a popular technical analysis tool used by traders to identify trends and potential entry and exit points in the stock market. It is a type of moving average that places more weight on recent price data, making it more responsive to changes in the market compared to other moving averages.
The EMA is calculated by taking the average of a specified number of previous closing prices and giving more weight to the most recent price data. The formula for calculating the EMA involves multiplying the previous EMA value by a smoothing factor and adding the current price multiplied by one minus the smoothing factor. The smoothing factor, also known as the smoothing constant, determines the weight given to the most recent price data.
Read Also: Learn the rules and strategies to play Marvel match
Traders use the EMA to identify trends and determine potential buy or sell signals. When the price is below the EMA, it is considered a bearish signal, indicating that the stock may be in a downtrend. Conversely, when the price is above the EMA, it is considered a bullish signal, indicating that the stock may be in an uptrend.
In addition to identifying trends, the EMA can also be used to generate entry and exit signals. Traders often look for crossovers between the EMA and the price as potential entry or exit points. A bullish crossover occurs when the price moves above the EMA, indicating a potential buying opportunity. On the other hand, a bearish crossover occurs when the price moves below the EMA, indicating a potential selling opportunity.
It is important to note that the EMA is a lagging indicator, meaning that it is based on past price data and may not always accurately predict future price movements. Therefore, it is essential to use the EMA in conjunction with other technical analysis tools and indicators to make informed trading decisions.
In conclusion, the EMA is a valuable tool for traders in the stock market. It helps identify trends, generate entry and exit signals, and provides valuable insights into the market’s behavior. However, it should be used in conjunction with other indicators and analysis techniques for a comprehensive approach to trading.
The 20 EMA indicator, or the 20-day Exponential Moving Average indicator, is a popular technical analysis tool used in the share market. It calculates the average price of a security over the past 20 days, giving more weight to the most recent price data.

The 20 EMA indicator is calculated by taking the average of the closing prices of the security over the past 20 days. It gives more weight to the most recent price data, which makes it more responsive to short-term price changes.
The 20 EMA indicator is used by traders and investors to identify trends and potential buy or sell signals in the share market. It can help in determining the overall direction of the market and can act as a support or resistance level for the price of a security.
The 20 EMA indicator can be used to make trading decisions by looking for potential buy or sell signals. For example, if the price of a security crosses above the 20 EMA from below, it may be a signal to buy. On the other hand, if the price crosses below the 20 EMA from above, it may be a signal to sell.
The 20 EMA indicator can be used alone in the share market, but it is often used in conjunction with other technical analysis tools to confirm signals and improve accuracy. Traders and investors may also consider other factors such as volume, support and resistance levels, and market trends when making trading decisions.
The 20 EMA indicator is a technical analysis tool that calculates the exponential moving average of the past 20 trading periods. It is commonly used by traders to identify trends and potential entry and exit points in the share market.

Examples of Accumulators: Understanding the Concept and Its Applications An accumulator is a device or mechanism used to store and accumulate energy …
Read Article
Do I pay tax on vested shares in Australia? Vested shares are a common form of employee remuneration in Australia. As employees work for a company, …
Read Article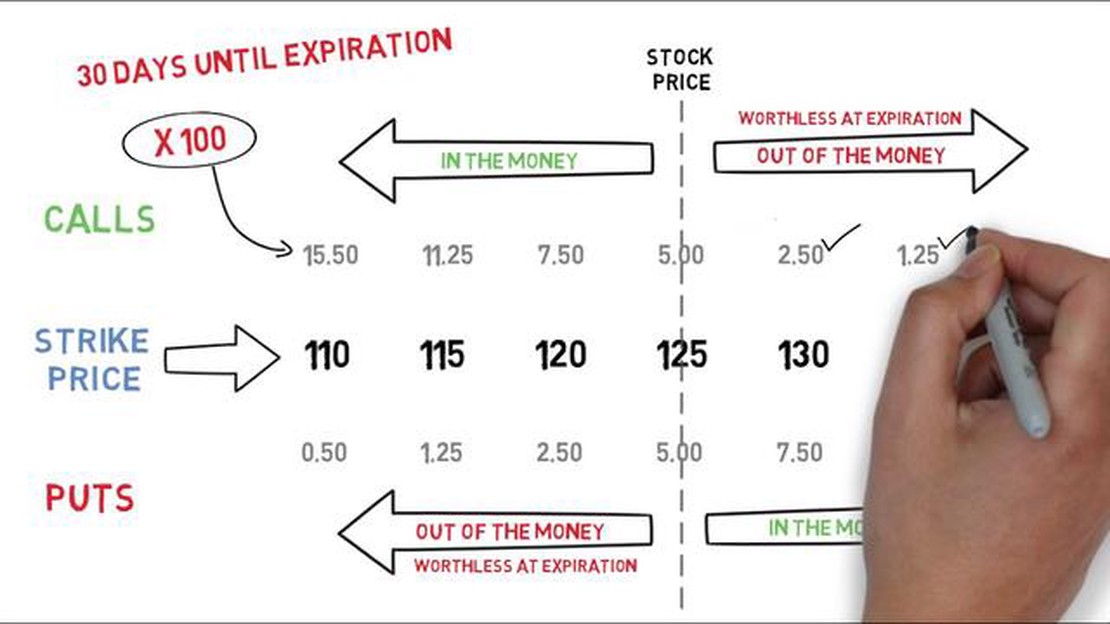
Understanding Option Trading and Its Mechanism Option trading is a versatile and potentially profitable investment strategy that allows traders to …
Read Article
Get Live Options Data in Excel: Comprehensive Guide Excel is a powerful tool for analyzing and managing data, but it can be limited when it comes to …
Read Article
Buying Stocks at a Discount with Options: A Comprehensive Guide Options are a powerful tool that can be used to buy stocks at a discounted price. This …
Read Article
9 30 Moving Average Strategy Explained: How to Use it for Trading The 9 30 Moving Average (MA) Strategy is a powerful tool that can unlock the …
Read Article


