

Understanding the Function of a Sell Stop in Forex Trading
Understanding the Sell Stop Function in Forex Trading In the world of forex trading, it is crucial to have a thorough understanding of the various …
Read Article
The 21 Moving Average is a commonly used technical analysis tool in the stock market. It is a trend-following indicator that helps traders identify the direction of a stock’s price movement over a specific period of time.
The Moving Average is calculated by taking the average closing price of a stock over the past 21 trading days. This period can be adjusted depending on the trader’s preference and trading style. The Moving Average is then plotted on a chart, creating a line that represents the average price of the stock over the specified period.
Traders use the 21 Moving Average to determine the overall trend of a stock. When the stock’s price is trading above the Moving Average, it is considered to be in an uptrend, indicating that the stock’s price is generally increasing. Conversely, when the stock’s price is trading below the Moving Average, it is considered to be in a downtrend, indicating that the stock’s price is generally decreasing.
In addition to helping identify the overall trend, the 21 Moving Average can also be used to generate buy and sell signals. When the stock’s price crosses above the Moving Average, it can be seen as a bullish signal to buy the stock. Conversely, when the stock’s price crosses below the Moving Average, it can be seen as a bearish signal to sell the stock.
Overall, the 21 Moving Average is a valuable tool for traders and investors alike. It provides a simple yet effective way to identify trends and generate trading signals, helping traders make more informed decisions in the stock market.
The 21 moving average is a commonly used technical indicator in financial markets. It is a simple moving average calculated by summing the closing prices of an asset over the past 21 periods and dividing the sum by 21. The resulting value represents the average price of the asset over the specified time period.
The 21 moving average is often used by traders and investors to analyze the overall trend of an asset. It is considered a short-term moving average, as it reflects price movements over a relatively small time period. This makes it sensitive to short-term fluctuations in price, allowing traders to identify potential buying or selling opportunities.
One of the main advantages of the 21 moving average is its ability to provide a smoother line compared to shorter moving averages. This can help traders filter out noise and focus on the overall trend of the asset. By using the 21 moving average as a reference point, traders can determine whether the price is trending upwards or downwards.
Moreover, the 21 moving average can act as a dynamic support or resistance level. When the price is above the 21 moving average, it can serve as a support level. Conversely, when the price is below the 21 moving average, it can act as a resistance level. These levels can be useful for setting stop-loss orders or determining potential price targets.

Additionally, the 21 moving average can be combined with other technical indicators to generate trading signals. For example, traders often use crossover strategies, where they monitor the interaction between the 21 moving average and another moving average, such as the 50 or 200 moving average. A bullish signal occurs when the 21 moving average crosses above the longer-term moving average, while a bearish signal occurs when it crosses below.
In conclusion, the 21 moving average is an important tool for traders and investors. It helps identify trends, filter out noise, and provide dynamic support and resistance levels. By understanding and utilizing the significance of the 21 moving average, traders can make more informed trading decisions in financial markets.
The 21 Moving Average is a commonly used technical indicator in financial market analysis. It is a simple moving average calculation that takes into account the closing prices of an asset over a set period of time, typically 21 days.
The moving average is calculated by adding up the closing prices for the specified period and dividing it by the number of days. This gives you the average price over that time frame. The 21 Moving Average is often used as a trend-following indicator, helping traders identify the overall direction that an asset is moving.
Read Also: Understanding the Period Moving Average: A Comprehensive Guide
The 21 Moving Average can be plotted on a price chart to visually represent the average price over time. When price is above the 21 Moving Average, it is generally considered to be in an uptrend, indicating that buying pressure may be stronger. Conversely, when price is below the 21 Moving Average, it is generally considered to be in a downtrend, suggesting that selling pressure may be stronger.
Traders may use the 21 Moving Average to generate trading signals. For example, if price crosses the 21 Moving Average from below, it could be seen as a buy signal. On the other hand, if price crosses the 21 Moving Average from above, it could be seen as a sell signal.
Additionally, the 21 Moving Average can help traders identify support and resistance levels. When price approaches the 21 Moving Average and bounces off it, it could be seen as a potential support or resistance level, depending on the direction of the trend.
It’s worth noting that the 21 Moving Average is just one of many moving averages that traders use. Different periods may be used depending on the trader’s time frame and trading strategy. However, the 21 Moving Average is widely used and can provide valuable insights into price trends and potential trading opportunities.
In conclusion, the 21 Moving Average is a popular technical indicator that helps traders identify trends, generate trading signals, and identify support and resistance levels. It can be a useful tool for traders looking to make informed decisions in the financial markets.
The 21 moving average is considered significant in technical analysis for several reasons. First, it is widely used by traders and investors due to its ability to provide a reliable measure of the overall trend in a security’s price. By calculating the average closing price over a specific period, such as 21 days, it smoothes out the short-term fluctuations and noise in the price data, making it easier to identify the dominant trend.
Read Also: Why Do Private Equity Firms Perform Leveraged Buyouts (LBOs)?
Furthermore, the 21 moving average is often used as a support or resistance level. In an uptrend, the average can act as a dynamic support level, indicating a potential buying opportunity when the price pulls back to the moving average. Conversely, in a downtrend, the average can act as a resistance level, providing a potential selling opportunity when the price approaches the moving average from below.
Additionally, the 21 moving average can help traders determine the strength of a trend. If the price consistently stays above the moving average in an uptrend or below the moving average in a downtrend, it suggests that the trend is strong and likely to continue. On the other hand, if the price repeatedly crosses back and forth over the moving average, it may indicate a weakening trend or a period of consolidation.
Moreover, the 21 moving average can be used in conjunction with other technical indicators and patterns to generate trading signals. For example, when the price crosses above the 21 moving average, it can be seen as a bullish signal, indicating a potential buying opportunity. Conversely, when the price crosses below the moving average, it can be seen as a bearish signal, indicating a potential selling opportunity.
In conclusion, the 21 moving average is significant because it helps traders and investors identify the overall trend in a security’s price, acts as a support or resistance level, indicates the strength of a trend, and generates trading signals when used in conjunction with other technical indicators. By understanding and utilizing the significance of the 21 moving average, traders can enhance their decision-making process and potentially improve their trading outcomes.

The 21 moving average is a technical indicator used in financial markets to determine the overall trend of a stock or any other asset. It is regarded as significant because it provides insight into the short-term momentum of the asset and helps traders identify potential buying or selling opportunities.
The 21 moving average is calculated by summing up the closing prices of an asset over the past 21 periods and dividing the sum by 21. This calculation is done continuously as new data becomes available, providing a smoothed line that represents the average price over the given period.
When the price crosses above the 21 moving average, it is often seen as a bullish signal. This crossover suggests that the momentum is shifting in favor of the buyers, indicating a potential upward trend. Traders may interpret this as a signal to buy the asset.
The 21 moving average is commonly used because it provides a balance between short-term and long-term trends. It is not too sensitive to minor price fluctuations, yet it still captures significant market movements. This makes it a popular choice among traders who want to analyze the overall trend while avoiding excessive noise in the data.
Absolutely! The 21 moving average can be used in conjunction with other technical indicators to enhance trading strategies. For example, some traders may use it in combination with a 50-day moving average to identify strong trends or with oscillators like the Relative Strength Index (RSI) to confirm overbought or oversold conditions. The key is to find a combination that suits your trading style and risk tolerance.
The 21 moving average is a commonly used technical indicator in trading. It helps to smooth out price data and provides a visual representation of the average price over a specific period of time. Traders use the 21 moving average to identify trends, determine support and resistance levels, and make more informed trading decisions.
The 21 moving average is calculated by adding the closing prices of the last 21 periods and then dividing the sum by 21. This is done to determine the average price over the specified time period. The calculation is repeated for each subsequent period to create a moving average line on the chart.

Understanding the Sell Stop Function in Forex Trading In the world of forex trading, it is crucial to have a thorough understanding of the various …
Read Article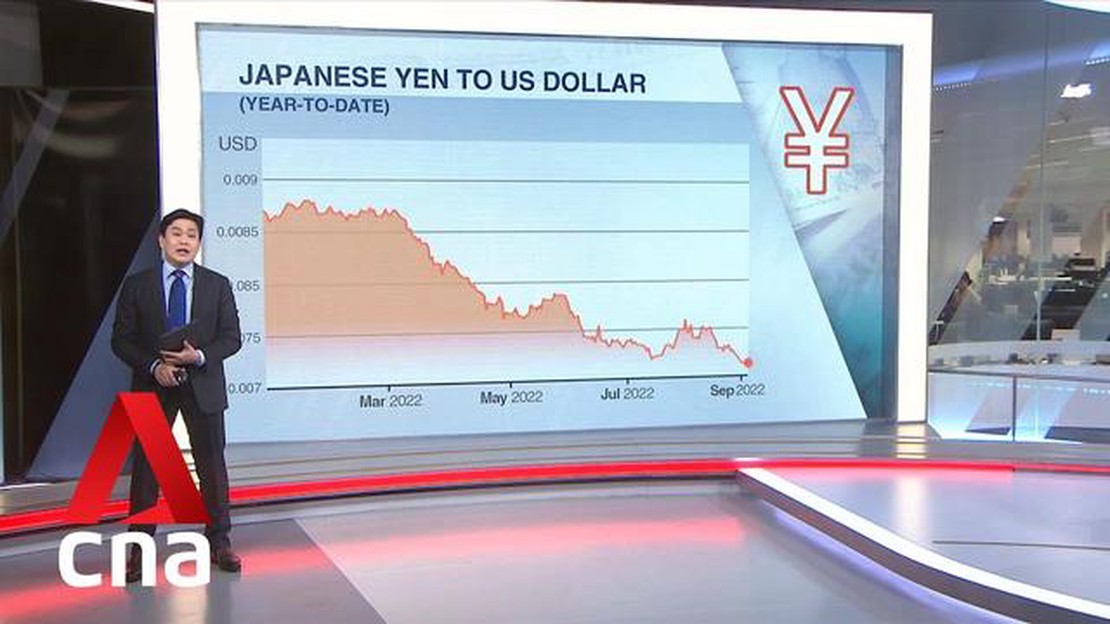
What is the lowest rate of yen to MYR? Are you a forex trader looking to get the best rates for your trades? Look no further! Our expert forex …
Read Article
Do trend lines work in forex? When it comes to analyzing and predicting market movements in the forex market, traders often turn to various tools and …
Read Article
Withdrawal of 1000% Bonus from Instaforex If you have been trading on the Instaforex platform, you might have come across the lucrative 1000% bonus …
Read Article
The Function of Exchange Bureaus: Explained In a globalized world where cross-border transactions are becoming increasingly common, exchange bureaus …
Read Article
Competitors of LMAX When it comes to foreign exchange trading platforms, LMAX is often considered a leader in the industry. However, it’s always …
Read Article


