

Understanding Forex PVC: What It Is and How It Works
Understanding Forex PVC: All You Need to Know Forex PVC, also known as foamex or foam PVC, is a type of rigid plastic material that has gained …
Read Article
In the world of financial analysis and trading, one of the key concepts is identifying trends in price data. This information plays a crucial role in making informed decisions about buying or selling assets. Moving averages are a popular tool used by analysts to identify and understand trends in price movements. By calculating an average of past prices over a specific period of time, moving averages provide important insights into the direction and strength of market trends.
Essentially, a moving average is a line that smooths out fluctuations in price data, creating a visual representation of the overall trend. There are different types of moving averages, including simple moving averages (SMA) and exponential moving averages (EMA), each with their own advantages and uses. Traders and analysts often use moving averages in combination with other technical indicators to gain a comprehensive view of market trends.
One of the primary ways moving averages help identify trends is by providing a clear visual representation of the direction of price movements. If a moving average line is sloping upward, it indicates an uptrend, while a downward slope suggests a downtrend. When the price crosses above or below a moving average line, it can signal a potential change in trend. Traders often use these crossover signals as entry or exit points to enter or exit positions.
Additionally, moving averages provide insights into the strength of market trends. If the price consistently stays above or below a moving average line, it suggests a strong trend. On the other hand, if the price frequently crosses back and forth over the moving average line, it indicates a weaker or sideways trend. By considering the slope and proximity of the price to the moving average, analysts can gauge the strength of the trend and make more informed trading decisions.
In conclusion, moving averages play a vital role in identifying and understanding trends in price movements. By smoothing out price data and providing clear visual signals, moving averages help traders and analysts identify the direction and strength of market trends. Whether you are a beginner or an experienced trader, understanding and utilizing moving averages can significantly enhance your trading strategies and increase your chances of making profitable trades.
When it comes to identifying trends in financial markets, moving averages play a crucial role. A moving average is a mathematical calculation that helps smooth out price data over a specified period of time, giving traders and investors a clearer understanding of the overall direction of a security’s price movement.

One of the key advantages of using moving averages is their ability to filter out short-term price fluctuations and noise, allowing traders to focus on the underlying trend. By smoothing out the price data, moving averages provide a visual representation of the average price over a specified period, making it easier to identify the general direction in which a security is moving.
Read Also: The Best Brokerages That Allow You to Trade Options - Find the Perfect One for You
There are various types of moving averages, including simple moving averages (SMA) and exponential moving averages (EMA). The SMA gives equal weight to each price point in the specified period, while the EMA puts more weight on recent prices, making it more responsive to current market conditions.
Traders often use moving averages in conjunction with other technical analysis tools, such as support and resistance levels or trendlines, to confirm the validity of a trend. For example, if the price of a security is consistently trading above its 50-day moving average and the moving average is sloping upwards, it could indicate an uptrend. Conversely, if the price is consistently trading below the moving average and the moving average is sloping downwards, it could indicate a downtrend.
Moving averages can also be used to generate trading signals. For example, a common strategy is to use a shorter-term moving average crossing above a longer-term moving average as a buy signal, and a shorter-term moving average crossing below a longer-term moving average as a sell signal.
In conclusion, moving averages are a powerful tool for identifying trends in financial markets. They provide traders and investors with a clear visual representation of the price movement over a specified period, helping to filter out noise and focus on the underlying trend. By using moving averages in conjunction with other technical analysis tools, traders can gain a better understanding of market dynamics and make more informed trading decisions.
Moving averages play a crucial role in identifying trends in financial markets. They are widely used by traders and investors to gain insights into the direction of price movement. Moving averages smooth out price data by calculating the average price over a specific period, creating a line that represents the average price level over that period.
One of the key advantages of moving averages is that they help filter out short-term price fluctuations and noise, making it easier to identify the overall trend. By looking at the slope and positioning of the moving average line, traders can determine whether the market is in an uptrend, downtrend, or consolidating.
Another important use of moving averages is in generating buy and sell signals. Traders often use the crossover of two moving averages as a signal to enter or exit a trade. For example, when a shorter-term moving average crosses above a longer-term moving average, it can indicate a buy signal, suggesting that the market is gaining upward momentum. Conversely, when a shorter-term moving average crosses below a longer-term moving average, it may signal a sell, indicating that the market is losing momentum.
Moving averages can also act as dynamic support and resistance levels. When prices approach a moving average, it often serves as a psychological barrier, with traders taking note and potentially reacting to the price action. If prices bounce off a moving average, it can be seen as a sign of support or resistance, depending on the direction of the price movement.
Read Also: Is Buy Back a Good Option? Pros and Cons | Your Guide
Overall, moving averages are a powerful tool in technical analysis, helping traders and investors make informed decisions based on price trends. They provide a clear visual representation of the underlying price action, allowing market participants to stay on the right side of the trend and potentially profit from price movements.

Moving averages are statistical tools that help identify trends in data over a specific period of time. They calculate the average value of a set of data points over a specified interval and create a line that smooths out fluctuations to show the overall trend.
Moving averages can help identify trends by providing a smoothed line on a chart that eliminates short-term fluctuations. By looking at the slope of the moving average line, traders can determine the direction of the trend - whether it’s upward, downward, or sideways. This information can be used to make informed decisions in trading and investing.
There are several types of moving averages, including the simple moving average (SMA), exponential moving average (EMA), weighted moving average (WMA), and the displaced moving average (DMA). Each type has its own unique formula and characteristics, but they all aim to smooth out price data to reveal trends.
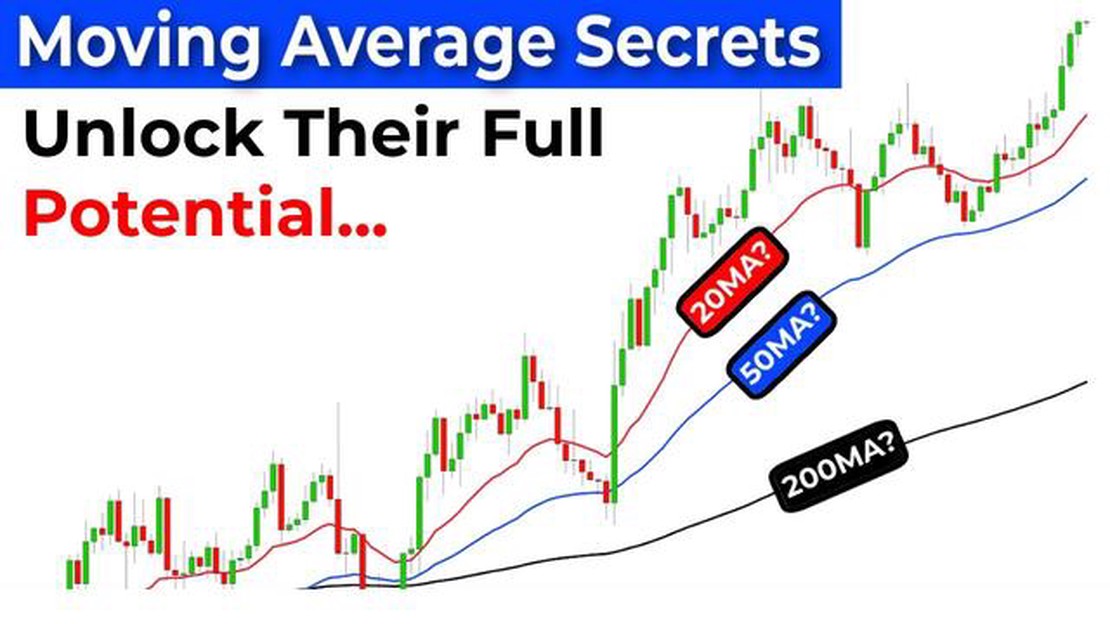
Traders use moving averages in various ways. One common strategy is to look for the “crossover” of two moving averages. For example, when a shorter-term moving average (like the 50-day SMA) crosses above a longer-term moving average (like the 200-day SMA), it may be a bullish signal. Conversely, when the shorter-term moving average crosses below the longer-term moving average, it may be a bearish signal.

Understanding Forex PVC: All You Need to Know Forex PVC, also known as foamex or foam PVC, is a type of rigid plastic material that has gained …
Read Article
What Does DFB Mean in Trading? DFB stands for daily funded bet, a term commonly used in trading to refer to a specific type of financial instrument. …
Read Article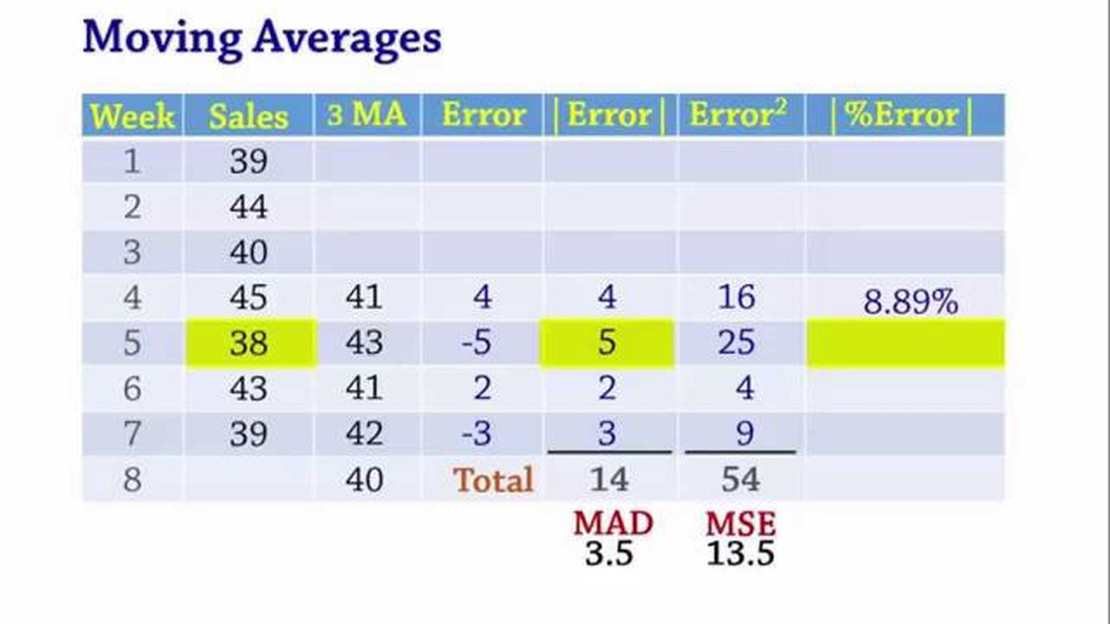
Understanding Moving Average in Production Management Moving average is a commonly used statistical tool in production management that helps …
Read Article
Is HDFC Bank Offering Forex Cards? If you are planning a trip abroad, whether for business or leisure, having a forex card can be a convenient and …
Read Article
How to Make Profit with a Limit Order When it comes to trading in the financial markets, one of the most important tools in a trader’s arsenal is the …
Read Article
Choosing the Best Trading Robot: A Comprehensive Guide In today’s fast-paced and highly competitive financial markets, traders are always on the …
Read Article


