

Complete Guide on Utilizing the ADX Indicator in Forex Trading
ADX Indicator in Forex Trading: A Comprehensive Guide The Average Directional Index (ADX) is a popular technical indicator used in forex trading to …
Read Article
When it comes to trading in the financial markets, having a solid understanding of technical indicators is essential for success. One of the most commonly used indicators is the moving average. This indicator helps traders identify trends and make informed decisions about buying and selling assets.
The moving average is a trend-following indicator that smooths out price data over a specific period of time. It is calculated by taking the average of a set number of past prices, and as new prices are added, the oldest prices are dropped from the calculation. This creates a moving average line on a chart that moves with the price action of the asset being analyzed.
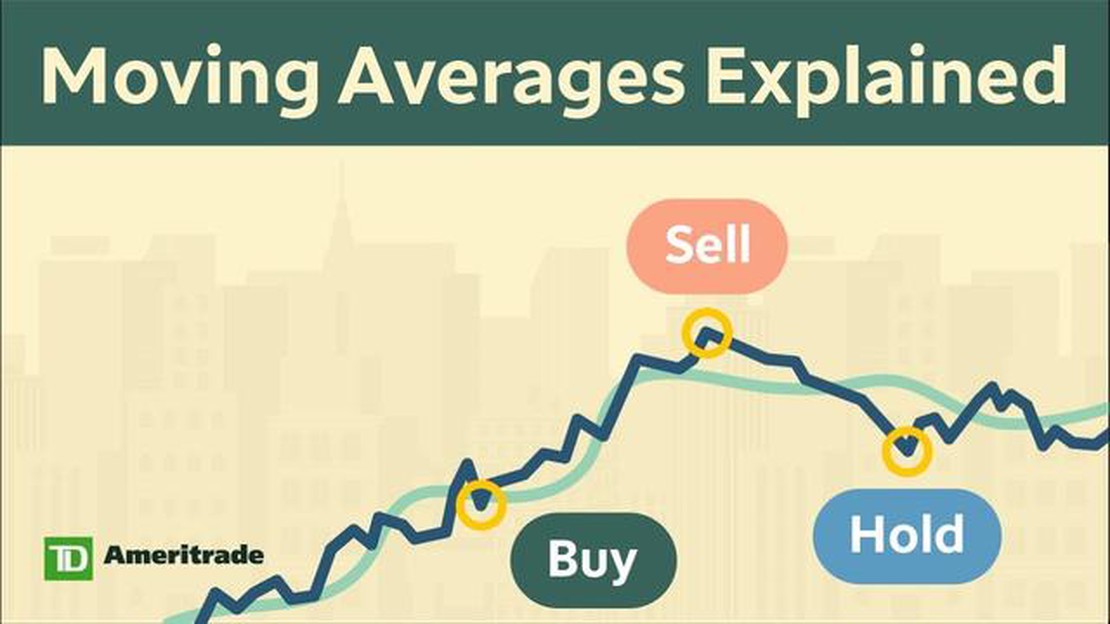
Traders use moving averages to identify the overall direction of a trend. When the moving average line is sloping upwards, it indicates an uptrend, while a downward sloping line indicates a downtrend. By analyzing the position of the price in relation to the moving average line, traders can determine whether to buy or sell an asset.
There are different types of moving averages, including simple moving averages (SMA) and exponential moving averages (EMA). The SMA gives equal weight to each price point in the calculation, while the EMA places more weight on recent prices. Both types of moving averages have their advantages and can be used in different trading strategies.
In this comprehensive guide, we will explore the various ways to use the moving average indicator in trading. We will cover topics such as moving average crossovers, support and resistance levels, and potential pitfalls to avoid. Whether you’re a beginner or an experienced trader, this guide will provide you with valuable insights into using the moving average indicator effectively in your trading strategy.

When it comes to analyzing trends and making informed trading decisions, moving averages are an essential tool that every trader should understand and utilize. A moving average is a statistical calculation that is used to analyze past price data and identify trends over a specific period of time. By smoothing out price data, moving averages make it easier to identify the overall direction of the market.
One of the main benefits of using moving averages is that they can help traders filter out noise and focus on the longer-term trend. There are different types of moving averages, including simple moving averages (SMA) and exponential moving averages (EMA), each with their own unique calculation methods.
A simple moving average is calculated by summing up the closing prices of a specific number of periods and then dividing the sum by the number of periods. This provides traders with a smoothed out line that represents the average price over a certain period. On the other hand, an exponential moving average gives more weight to recent price data, making it more responsive to the most recent price changes.
Moving averages can be used in different ways to generate trading signals. For example, when the price crosses above the moving average, it can be considered a bullish signal, indicating that the trend is likely to continue upwards. Conversely, when the price crosses below the moving average, it can be seen as a bearish signal, suggesting that the trend may reverse to the downside.
In addition to providing trading signals, moving averages can also act as support or resistance levels. When the price approaches a moving average, it tends to bounce off or consolidate around that level, which can be valuable information for traders. By combining moving averages with other technical indicators, traders can develop a more robust and comprehensive trading strategy.
| Advantages | Disadvantages |
|---|---|
| - Helps identify trends | - Can lag behind price action |
| - Filters out noise | - Can generate false signals in choppy markets |
| - Acts as support/resistance levels | - May not be suitable for short-term trading |
| - Can be used in combination with other indicators | - Requires periodic adjustment of parameters |
Read Also: Calculating the 3-Month Moving Average: A Step-by-Step Guide
In conclusion, moving averages are a fundamental tool that can provide traders with valuable insights about market trends and potential trading opportunities. By understanding how moving averages work and incorporating them into their trading strategy, traders can increase their chances of making informed decisions and achieving their trading goals.
When it comes to using moving averages as a trading indicator, there are several different types that traders can choose from. Each type has its own unique characteristics and can provide valuable insights into market trends and price movements.
Read Also: Is Option Trading Halal or Haram in Islam? Exploring the Rulings and Perspectives
One of the most common types of moving averages is the simple moving average (SMA). This type of moving average calculates the average price over a specific period of time, giving equal weight to each data point. The SMA is a straightforward and easy-to-understand indicator that can be used to identify trends and potential support and resistance levels.
Another type of moving average is the exponential moving average (EMA). Unlike the SMA, the EMA assigns more weight to recent data points, making it more responsive to recent price changes. This can be particularly useful for short-term traders who are looking to capitalize on quick price movements.
In addition to the SMA and EMA, there are also other types of moving averages such as the weighted moving average (WMA) and the hull moving average (HMA). The WMA assigns different weights to each data point, placing more emphasis on recent prices. The HMA takes into account the square root of the number of periods used in the calculation, resulting in a smoother and more accurate moving average.
The choice of which moving average to use ultimately depends on the trader’s trading style and the specific market conditions. Some traders may prefer using a shorter-term moving average to capture quick price movements, while others may prefer a longer-term moving average to filter out noise and identify long-term trends.
Regardless of the type of moving average used, these indicators play an important role in technical analysis and can help traders make informed trading decisions. By identifying trends, support and resistance levels, and potential entry and exit points, moving averages provide valuable insights into market dynamics.
In conclusion, understanding the different types of moving averages and their importance is vital for traders looking to incorporate this popular trading indicator into their strategy. Whether it’s the simple moving average, exponential moving average, or other variants, each type offers its own unique benefits and can provide valuable information about market trends and price movements.

A moving average is a popular technical analysis tool used to analyze trends over a specified period of time. It is calculated by taking the average price of a security over a set number of periods.
A moving average is calculated by adding the closing prices of a security over a specified number of periods and dividing by that number. For example, a 50-day moving average would sum up the closing prices of the last 50 days and divide by 50.
The choice of moving average period depends on the trader’s trading strategy and timeframe. Shorter moving averages, like the 20-day moving average, are more sensitive to price changes and provide quicker signals. Longer moving averages, like the 200-day moving average, are slower to react but often used to identify longer-term trends.
Yes, moving averages can be used to identify potential support and resistance levels. When a security’s price crosses above a moving average, it may indicate a bullish breakout and the moving average can act as a support level. Conversely, when the price crosses below a moving average, it may indicate a bearish breakout and the moving average can act as a resistance level.

ADX Indicator in Forex Trading: A Comprehensive Guide The Average Directional Index (ADX) is a popular technical indicator used in forex trading to …
Read Article
What is the nickname for GBP USD? The GBP USD currency pair is one of the most widely traded currency pairs in the forex market. It represents the …
Read Article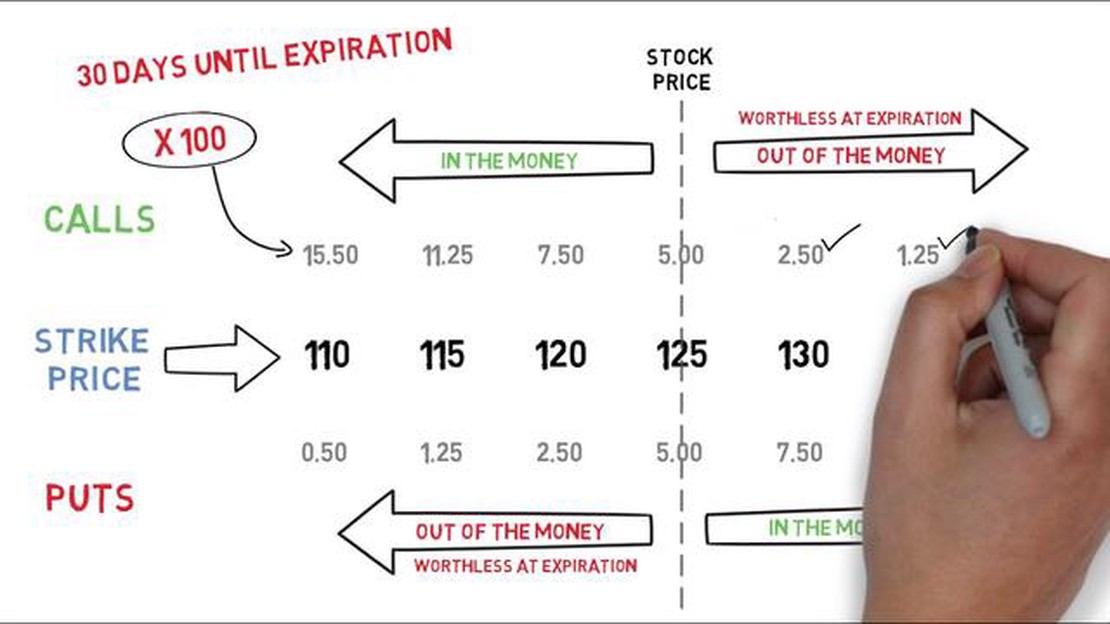
Understanding the Fair Price of an Option Contract An option contract is a financial instrument that grants the holder the right, but not the …
Read Article
What is forex sentiment? Forex sentiment is a crucial factor that influences the foreign exchange market and plays a significant role in shaping …
Read Article
Understanding Clearing and Account Numbers with Swedbank When it comes to banking, understanding the different codes and numbers associated with your …
Read Article
Understanding the Difference between Issued and Outstanding Stock Options Stock options are a common form of compensation that companies offer to …
Read Article


