


Convert 200k Rp to EUR: Exact Currency Exchange Rate
How much is 200k Rp in EUR? If you’re planning a trip to Indonesia or have recently returned from the beautiful country, you may find yourself needing …
Read Article
The Average Directional Index (ADX) is a popular technical indicator used in forex trading to determine the strength of a trend. It was developed by J. Welles Wilder and is widely used by traders to identify potential trading opportunities.
The ADX indicator consists of three lines: the ADX line, the +DI line, and the -DI line. The ADX line measures the strength of the trend, while the +DI line represents the bullish direction and the -DI line represents the bearish direction. By analyzing the interaction between these lines, traders can gain valuable insights into the market.
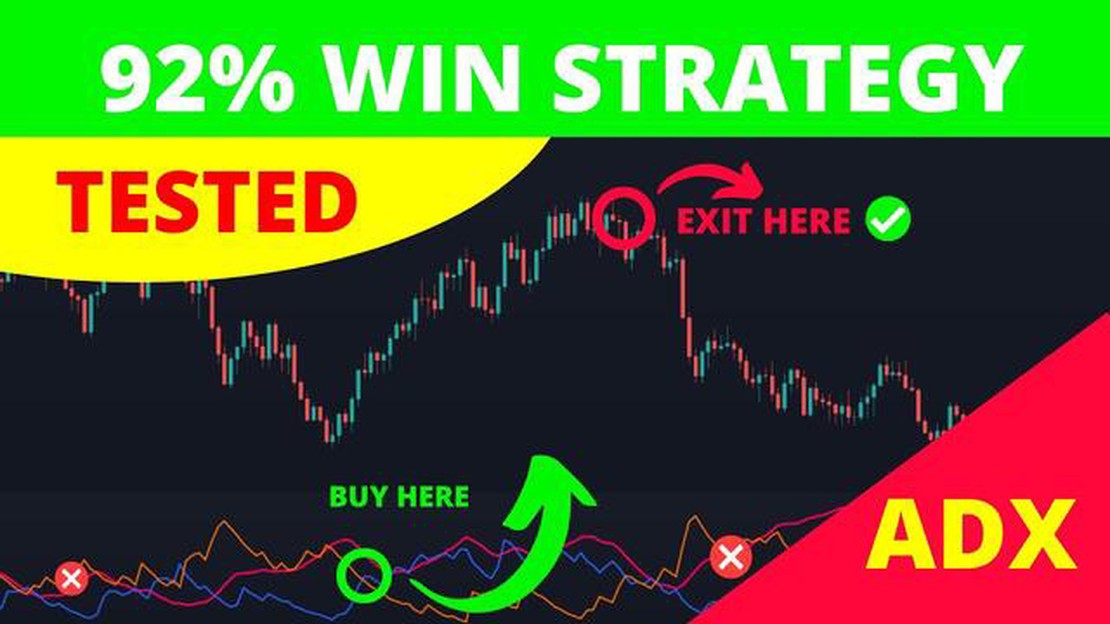
One of the main advantages of using the ADX indicator is its ability to filter out noise and identify strong trends. When the ADX line rises above a certain threshold, typically 25, it indicates a strong trend. Traders can use this information to enter trades and ride the trend, increasing their chances of profitability.
Another useful feature of the ADX indicator is its ability to identify trend reversals. When the ADX line starts to decline after reaching a high point, it signals a weakening trend. This can be a valuable signal for traders to exit their positions or take counter-trend trades.
It’s important to note that the ADX indicator is not a standalone tool, but rather should be used in conjunction with other technical indicators and analysis techniques. Traders should also consider other factors such as market news, economic data, and overall market conditions before making trading decisions.
In conclusion, the ADX indicator is a powerful tool that can help traders identify and capitalize on strong trends in the forex market. By understanding how to interpret the ADX line, +DI line, and -DI line, traders can make more informed trading decisions and potentially increase their profits. However, like all technical indicators, the ADX indicator should be used as part of a comprehensive trading strategy and not relied upon as the sole basis for making trading decisions.

The Average Directional Index (ADX) is a popular technical indicator used by forex traders to measure the strength of a trend. It is often used to determine the presence of a trending market or to identify potential trend reversals.
The ADX indicator is comprised of three lines – the ADX line, the +DI line, and the -DI line. The ADX line represents the strength of the overall trend, while the +DI line measures the upward movement and the -DI line measures the downward movement.
Traders use the ADX indicator to make informed decisions about when to enter or exit a trade. When the ADX line is rising, it indicates that the trend is gaining strength, and it may be a good time to enter a trade in the direction of the trend. Conversely, when the ADX line is falling, it suggests that the trend is weakening, and it may be a signal to exit a trade or prepare for a potential trend reversal.
Additionally, the +DI and -DI lines provide valuable information about the direction of the trend. When the +DI line is above the -DI line, it indicates that the upward trend is dominant, and traders may consider going long or buying. Conversely, when the -DI line is above the +DI line, it suggests that the downward trend is dominant, and traders may consider going short or selling.
Traders can also use the ADX indicator to identify potential trend reversals. When the ADX line reaches extreme levels, such as above 40 or below 20, it suggests that the current trend may be losing momentum and a reversal may be imminent. This can help traders prepare for a possible change in market direction.
Read Also: Discover the Most Accurate Indicator for Option Trading
It is important to note that the ADX indicator is a lagging indicator, meaning it does not predict future price movements. Instead, it provides information about the current trend and its strength. Therefore, it is recommended to use the ADX indicator in conjunction with other technical analysis tools to confirm trade signals and make more informed trading decisions.
| ADX Level | Trend Strength |
|---|---|
| 0-20 | Weak Trend |
| 20-40 | Moderate Trend |
| 40-60 | Strong Trend |
| 60-80 | Very Strong Trend |
| 80-100 | Extremely Strong Trend |
Read Also: Buying Volkswagen Shares in India: An Ultimate Guide
The Average Directional Index (ADX) is a popular technical indicator used in forex trading to measure the strength of a trend. Developed by J. Welles Wilder, Jr., the ADX can help traders determine the presence and direction of a trend, as well as the strength of the trend.
The ADX indicator consists of three lines: the ADX line itself, which represents the strength of the trend; the +DI line, which shows the strength of the positive trend; and the -DI line, which indicates the strength of the negative trend. These lines are plotted on a scale of 0 to 100.
When the ADX line is above 25, it suggests that a trend is present and that it is gaining strength. A reading above 50 indicates a very strong trend. On the other hand, a reading below 25 indicates a weak or non-existent trend.
The +DI and -DI lines can be used to identify the direction of the trend. When the +DI line is above the -DI line, it indicates a positive (upward) trend. Conversely, when the -DI line is above the +DI line, it suggests a negative (downward) trend.
The ADX indicator is often used in conjunction with other technical indicators to confirm signals or identify potential trading opportunities. For example, traders may use the ADX in combination with a moving average crossover or a trendline break to determine the best entry and exit points for a trade.

Overall, the ADX indicator is a valuable tool for forex traders as it helps them identify strong trends and potential trading opportunities. By understanding the strength and direction of a trend, traders can make better-informed decisions and increase their chances of success in the forex market.
The ADX indicator, also known as the Average Directional Index, is a popular technical analysis tool used in forex trading. It helps traders determine the strength of a trend and whether it is worth trading or not.
The ADX indicator is calculated using a mathematical formula that takes into account the high, low, and close prices of a currency pair over a certain period of time. It then produces a value between 0 and 100, indicating the strength of the trend.
A high ADX value indicates a strong trend in the market. Traders can use this information to identify potential trading opportunities and make informed decisions based on the strength of the trend.
The ADX indicator can be used in various ways in a forex trading strategy. Some traders use it to confirm the presence of a trend before entering a trade, while others use it to determine the strength of a trend and adjust their position sizing accordingly. It can also be used in conjunction with other technical indicators to improve the accuracy of trading signals.

How much is 200k Rp in EUR? If you’re planning a trip to Indonesia or have recently returned from the beautiful country, you may find yourself needing …
Read Article
Is FBS legal in Pakistan? When it comes to trading forex and other financial instruments in Pakistan, many traders are concerned about the legality of …
Read Article
Understanding the Difference Between Forex and Stocks When it comes to investing, two of the most popular options are forex and stocks. Both markets …
Read Article
Do non-qualified stock options expire? Non-qualified stock options (NSOs) are a popular form of employee compensation that give employees the right to …
Read Article
How Does Option Trade Work? Option trading is a fascinating and complex world, filled with different strategies and terms that can seem overwhelming …
Read Article
The Best Strategy in the Art of War: Unveiling Timeless Tactics The Art of War, written by Sun Tzu over 2,500 years ago, is not just a classic …
Read Article


