
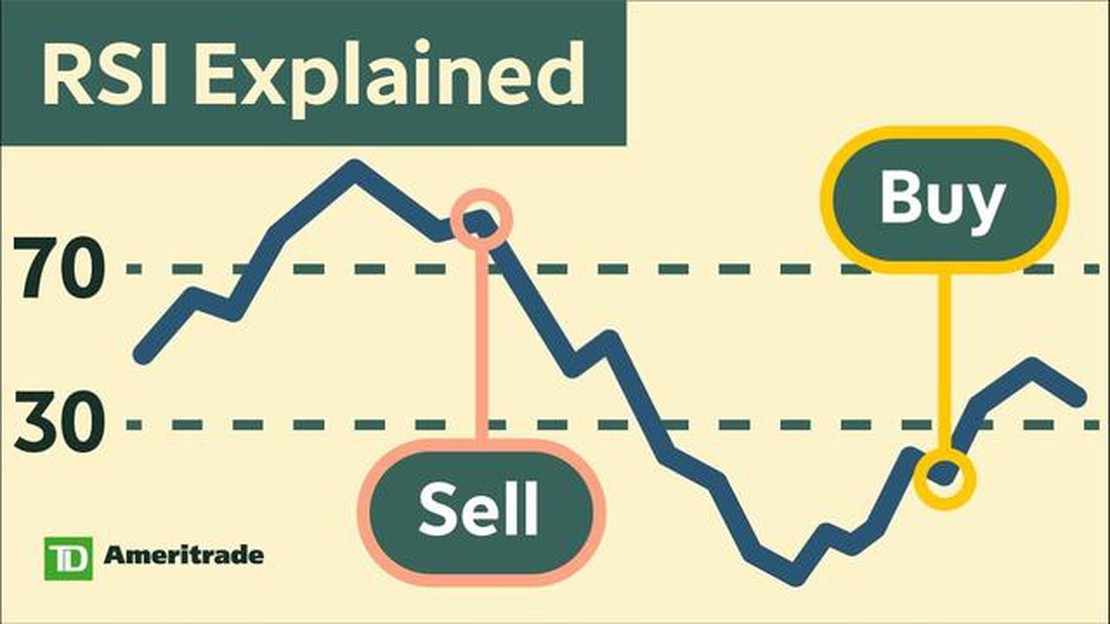

Understanding the Significance of a high RSI: What Does it Mean?
Understanding the implications of a high RSI When it comes to analyzing stocks, one of the key indicators that investors use is the Relative Strength …
Read Article
Are you looking to analyze trends or identify patterns in your data? One useful tool to achieve this is the 3-month moving average. Whether you’re a business owner, a financial analyst, or a data enthusiast, knowing how to calculate the 3-month moving average can provide valuable insights into your data.
The 3-month moving average is a statistical technique that helps smooth out fluctuations in data over time. It calculates the average of a specified number of observations within a given time period and moves the window of observations forward, recalculating the average at each step. This technique is particularly useful for identifying long-term trends and reducing the impact of seasonal or random fluctuations.
In this step-by-step guide, we will walk you through the process of calculating the 3-month moving average. We will explain the concept behind this technique, provide examples to illustrate its application, and guide you on how to interpret the results. By the end of this guide, you’ll have the knowledge and skills to confidently use the 3-month moving average in your data analysis.
Disclaimer: The 3-month moving average is just one of many statistical techniques available for data analysis. It may not be suitable for all types of data or situations. It’s important to consider the specific characteristics of your data and consult with experts or reference materials when necessary.
A moving average is a commonly used statistical calculation that helps smooth out fluctuations in data over a specific time period. It is often used in financial markets to analyze trends and make predictions based on historical data.
The moving average is calculated by taking the average of a set of data points within a defined time frame. Each data point is given equal weight, and as new data points become available, older data points are dropped, creating a “moving” time window.
Moving averages can be used to identify trends, support and resistance levels, and potential buy or sell signals. They can be calculated using different time periods, depending on the level of smoothing desired. Shorter time frames result in a more sensitive moving average, while longer time frames provide a smoother line.
There are various types of moving averages, but the most commonly used ones are the simple moving average (SMA) and the exponential moving average (EMA). The SMA simply calculates the average of a set of data points, while the EMA gives more weight to recent data points, making it more responsive to changes in the data.
Benefits of using moving averages:

Overall, moving averages are a valuable tool for analyzing data trends and making informed decisions based on historical data. Understanding how they are calculated and when to use them can help investors and traders make more informed decisions in the financial markets.
Read Also: Find the Top Bank Nifty Option Tips Provider for Maximum Profits
A moving average is a widely used statistical calculation that is used to analyze data over a period of time by smoothing out fluctuations and highlighting trends. It is a method of calculating the average value of a data set over a specified number of periods.
The moving average is particularly useful for analyzing financial data, such as stock prices or sales figures, as it helps to identify trends and patterns in the data. It is often used as a tool for technical analysis in trading and investing.
There are different types of moving averages, including the simple moving average (SMA), exponential moving average (EMA), and weighted moving average (WMA). The choice of which moving average to use depends on the specific analysis and the preferences of the analyst.
To calculate a moving average, a set of data points is selected and the average value of these points is calculated. This average is then shifted along the data set, with each subsequent average calculated using a new set of data points.
Read Also: Understanding the Significance of the Weighted Moving Average
The moving average helps to smoothen out short-term fluctuations in the data, making it easier to identify long-term trends. It is commonly used in forecasting and trend analysis, as it provides a clearer picture of the underlying patterns in the data.
Overall, the moving average is a powerful statistical tool that is widely used in various fields, including finance, economics, and engineering, to analyze and interpret data. It is a valuable tool for understanding trends and patterns in a data set, and can be used to make predictions and forecasts based on historical data.
A 3-month moving average is a popular method of smoothing out fluctuations in data over a specific time period. It helps to provide a clearer picture of the overall trend by reducing the impact of short-term fluctuations or noise in the data.
Here are a few reasons why using a 3-month moving average can be beneficial:
| 1. | Identifying long-term trends: |
| By calculating the average of the data over 3 months, you can identify whether the trend is moving upwards, downwards, or remaining relatively stable. This can be useful in analyzing sales data, stock prices, or any other dataset that exhibits fluctuations. | |
| 2. | Smoothing out seasonal patterns: |
| Many datasets exhibit seasonal patterns, where values tend to be higher or lower during certain times of the year. By using a moving average, you can smooth out these seasonal fluctuations and focus on the underlying trend. | |
| 3. | Identifying turning points: |
| A moving average can help identify turning points in a dataset, where the trend changes direction. If the moving average line starts to move upwards after a period of decline, it may indicate a potential reversal in the trend. | |
| 4. | Reducing the impact of outliers: |
| Outliers or extreme values in a dataset can distort the overall picture. By taking an average over 3 months, the impact of individual outliers is reduced, ensuring a more accurate representation of the underlying trend. | |
| 5. | Easy to calculate and understand: |
| Calculating a 3-month moving average is relatively simple and can be done using basic mathematical operations. The resulting line can be easily interpreted and understood by analysts or decision-makers. |

In conclusion, using a 3-month moving average can help to smooth out fluctuations in data, identify long-term trends, and reduce the impact of outliers. It is a useful tool for analyzing data and making informed decisions based on the underlying trend.
A 3-month moving average is a calculation that helps smooth out short-term fluctuations in data by taking the average of the data over a 3-month period.
Calculating a 3-month moving average can be useful in identifying trends and patterns in data, especially when there are seasonal or cyclical fluctuations that may not be immediately apparent in the raw data.
To calculate a 3-month moving average, you need to add up the data values for the past three months and then divide by 3. This process is repeated for each subsequent month to create a moving average trend line.
Yes, you can use a different time period for the moving average calculation depending on your needs. Common options include 2-month, 4-month, and 6-month moving averages.
While a 3-month moving average can help smooth out short-term fluctuations, it may not be suitable for all data sets. In some cases, a longer or shorter time period may be more appropriate. Additionally, it’s important to consider the context and underlying factors influencing the data before making conclusions based on the moving average.
A moving average is a calculation that helps smooth out fluctuations in data to identify trends over a certain period of time. It is commonly used in finance and statistics.

Understanding the implications of a high RSI When it comes to analyzing stocks, one of the key indicators that investors use is the Relative Strength …
Read Article
Understanding Moving Average in Time Series Analysis A time series is a collection of data points that are recorded in chronological order over a …
Read Article
Unrealized Foreign Exchange Losses: Can They Be Deducted? Foreign exchange losses can have a significant impact on businesses, especially those …
Read Article
Is OctaFX Legit in the Philippines? OctaFX is a renowned online broker that has gained popularity among traders in the Philippines. As a trader, it is …
Read Article
How to win the snake pattern Snake Pattern is a classic arcade game that has stood the test of time. The objective of the game is simple: maneuver a …
Read Article
Understanding Mat Moving Annual Turnover Moving annual turnover (MAT) is a measure used to analyze the performance of a company over a specific period …
Read Article


