


What is the Best Hour to Buy ETF? Expert Advice and Tips
What is the best hour to buy ETF? Investing in exchange-traded funds (ETFs) can be a great way to diversify your portfolio and capitalize on market …
Read Article
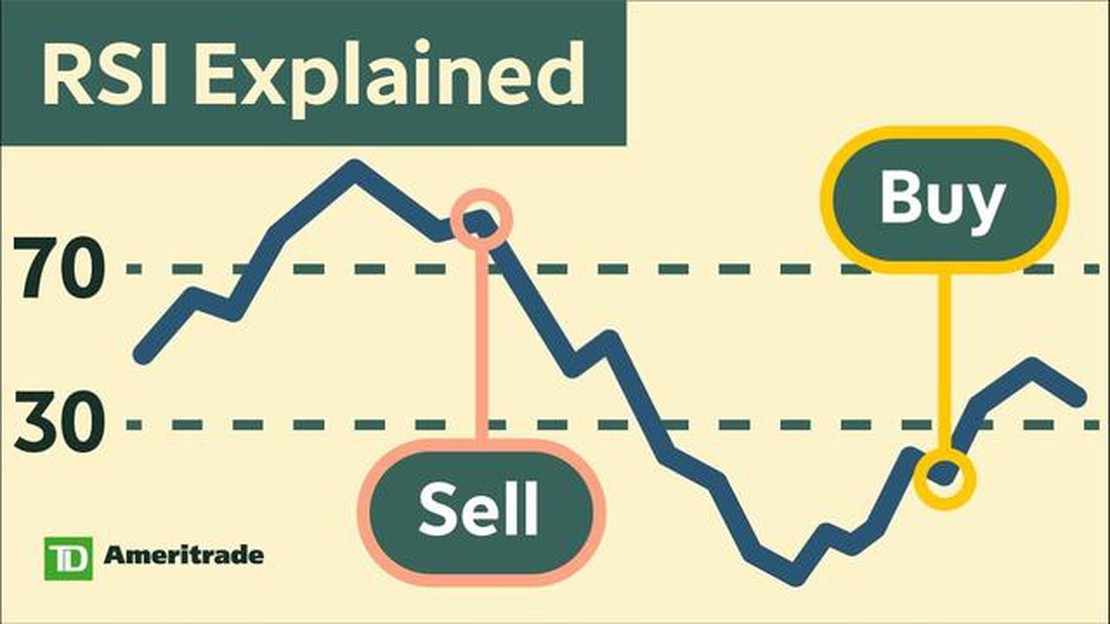
When it comes to analyzing stocks, one of the key indicators that investors use is the Relative Strength Index (RSI). The RSI is a technical indicator that measures the strength and speed of a stock’s price movement. It is often used to determine if a stock is overbought or oversold, and can provide valuable insights into market trends.
A high RSI can indicate that a stock is experiencing a period of strong momentum and may be overbought. This means that the stock’s price has appreciated rapidly and may be due for a correction. It is important to note, however, that a high RSI does not necessarily mean that a stock is going to decline in value. It simply suggests that the stock has experienced a significant increase in price and may be due for a period of consolidation.
Traders and investors can use a high RSI as a signal to take profits or to consider selling a stock. When the RSI is nearing or above 70, it may be an indication that the stock is becoming overbought and could be reaching a point of exhaustion. This is when it may be wise to consider selling or taking profits.
On the other hand, a high RSI can also be seen as a positive signal for a stock. If a stock’s price has been steadily increasing and the RSI remains consistently high, it may suggest that the stock is in a strong uptrend and could continue to rise in value. In this case, investors may use a high RSI as a signal to hold onto their positions or even consider buying more stock.
Overall, understanding the significance of a high RSI is crucial for investors who want to make informed decisions about their investments. By carefully analyzing the RSI and considering other factors, investors can gain valuable insights into market trends and potentially improve their trading strategies.

A high RSI (Relative Strength Index) is an important indicator in technical analysis as it provides insights into the strength and momentum of a security’s price movement. RSI is a commonly used oscillating indicator that measures the magnitude and speed of price changes. It is an essential tool for traders and investors in understanding market conditions and making informed trading decisions.
When the RSI reaches high levels, usually above 70, it indicates that the security is overbought, meaning that it has experienced a significant price increase and may be due for a correction or a trend reversal. It suggests that the security’s price may be unsustainable and that there could be potential selling pressure in the market.
A high RSI is important because it presents an opportunity for traders to consider taking profits or implementing risk management strategies such as setting stop-loss orders. It can be a warning sign for potential price weakness or a trend reversal, prompting traders to consider reducing their exposure to the security or exploring short-selling opportunities.
Furthermore, a high RSI can also provide confirmation for a bullish trend. If a security’s price continues to reach higher highs accompanied by a rising RSI, it suggests that the uptrend is strong and likely to continue. Traders can use the high RSI as a confirmation signal to enter long positions or consider adding to existing positions to capitalize on the continued price appreciation.
Read Also: How much is 100,000 USD in HKD? Find out now!
Overall, a high RSI is an important metric for traders and investors as it warns of potential overbought conditions or supports a bullish trend. By incorporating the RSI into their analysis, market participants can make more informed and timely trading decisions to maximize gains or protect themselves from potential losses.
The Relative Strength Index (RSI) is a commonly used technical indicator that helps traders and analysts determine the strength and momentum of a particular asset. It is primarily used in the field of technical analysis to identify overbought and oversold conditions in the market.
The RSI is calculated using a formula that compares the average gain and average loss of an asset over a specified period of time. This formula results in a value that ranges from 0 to 100, with values above 70 indicating overbought conditions and values below 30 indicating oversold conditions.
One of the key principles behind the RSI is that it provides a measure of the underlying strength or weakness of an asset, which can be used to anticipate potential reversals in the price trend. When the RSI is above 70, it suggests that the asset may be overvalued and due for a pullback. Conversely, when the RSI is below 30, it suggests that the asset may be undervalued and due for a rebound.
Traders and analysts often use the RSI in combination with other technical indicators and chart patterns to make more informed trading decisions. For example, they may look for divergences between the RSI and the price of the asset, or use the RSI to confirm or refute signals from other indicators.
It is important to note that the RSI is not a standalone indicator and should be used in conjunction with other forms of analysis and risk management strategies. While it can be a valuable tool for identifying potential trading opportunities, it should not be relied upon as the sole basis for making investment decisions.
Read Also: Understanding the Managed Futures Strategy Fund: A Guide for Investors
| RSI Value | Interpretation |
|---|---|
| Above 70 | Overbought |
| Between 30 and 70 | Neutral |
| Below 30 | Oversold |
In conclusion, the Relative Strength Index is a powerful tool for understanding the strength and momentum of an asset. By using the RSI in conjunction with other technical analysis tools, traders can gain valuable insights into potential market reversals and make more informed trading decisions.
RSI stands for Relative Strength Index, and it is a technical indicator used in trading to measure the speed and change of price movements. It is significant because it helps identify overbought or oversold conditions in the market, which can be used to make trading decisions.
RSI is calculated using a formula that takes into account the average gain and average loss over a specified period of time. The formula is: RSI = 100 - (100 / (1 + RS)), where RS is the average gain divided by the average loss.

A high RSI indicates that the price has been rising strongly and there may be an overbought condition in the market. This means that the price may be due for a pullback or reversal in the near future.
A high RSI can be a good sign for traders if they are looking for short-term profits from a potential pullback or reversal in the market. However, it is important to note that RSI alone is not enough to make trading decisions, and it should be used in conjunction with other technical indicators and analysis.
Traders can use a high RSI as a signal to potentially sell or take profits on a long position. They can also use it as an opportunity to enter a short position if they believe the price is due for a reversal. Additionally, traders can combine RSI with other indicators to confirm their trading decisions.

What is the best hour to buy ETF? Investing in exchange-traded funds (ETFs) can be a great way to diversify your portfolio and capitalize on market …
Read Article
Python for Stock Trading: Can You Use it to Make Profit? Python has gained popularity among traders and investors for its versatility and ease of use …
Read Article
Strategies for avoiding taxes on Forex trading When it comes to trading forex, it’s important to not only focus on making profits but also on …
Read Article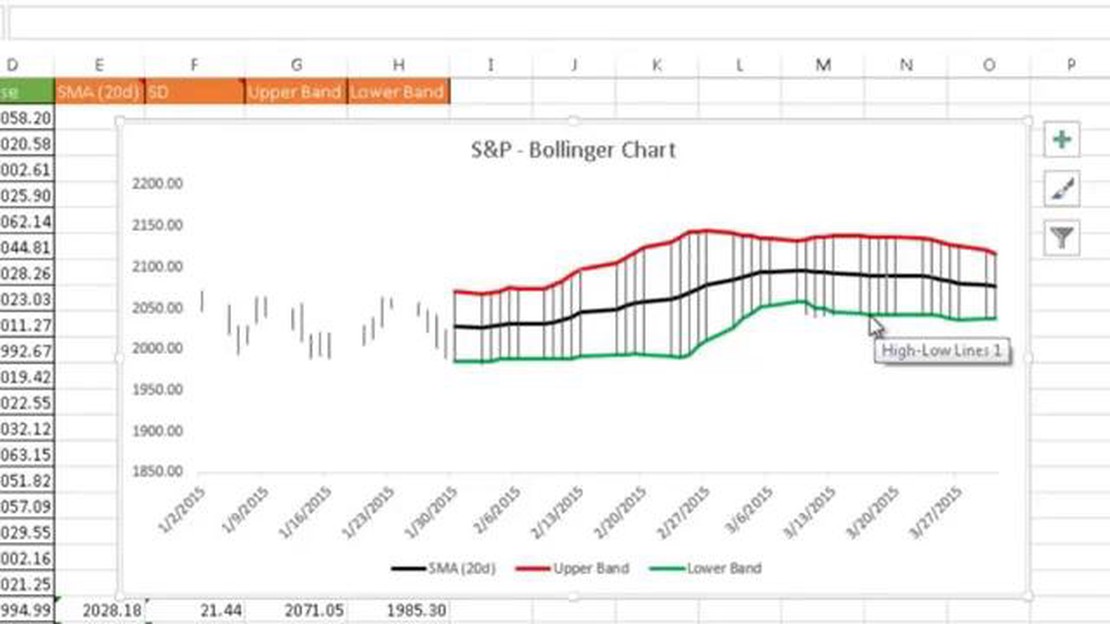
Adding Bollinger Bands in Excel: Step-by-Step Guide If you’re a stock trader or investor, you’ve probably heard of Bollinger Bands. Created by John …
Read Article
Understanding the Legality of Online Forex Trading in Nigeria Forex trading has gained significant popularity in Nigeria in recent years. As more …
Read Article
When do 4-hour candles close? Understanding the timing of candlestick charts is essential for successful trading in the financial markets. One key …
Read Article


