


Are Santander and WBK the same? - Exploring the Differences and Similarities
Are Santander and WBK the same? When it comes to banking, there are numerous institutions that vie for customers’ attention. Two prominent names in …
Read Article

The Momentum Meter is an important technical indicator that allows traders to gauge the strength and direction of a price trend. By measuring the rate of change in price over a specific time period, the Momentum Meter provides insight into whether a stock or other asset is overbought or oversold. This indicator is commonly used by both beginner and experienced traders to make informed trading decisions.
At its core, the Momentum Meter calculates the difference between the current price and the price of a previous period. This difference is then plotted on a chart, typically as a line that oscillates around a central zero line. When the line is above zero, it indicates that the price is gaining upward momentum, while a line below zero suggests downward momentum. The steeper the line, the stronger the momentum.
The Momentum Meter can be used in several ways. First, it can help identify potential trend reversals. If the indicator shows a momentum divergence, where the price is making new highs or lows while the indicator is failing to do so, it may indicate that the current trend is weakening and a reversal could be imminent. In addition, traders can use the Momentum Meter to confirm a trend by looking for an alignment between the direction of the price and the indicator. For example, if the price is making higher highs and the indicator is also increasing, it suggests a strong bullish trend.
Furthermore, the Momentum Meter can provide valuable insight into potential overbought or oversold conditions. When the indicator reaches extreme values, either above or below a certain threshold, it may suggest that the price is due for a correction. For example, if the indicator reaches a highly overbought level, it could indicate that the price has risen too far too fast and may be primed for a pullback. Conversely, an extreme oversold reading may suggest that the price has been selling off excessively and could be due for a rebound.
In conclusion, the Momentum Meter is a powerful tool that can help traders identify trends, confirm price movements, and spot potential reversals or overbought/oversold conditions. However, like any technical indicator, it is important to use the Momentum Meter in conjunction with other analysis techniques to increase the probability of accurate predictions. With proper understanding and application, the Momentum Meter can be a valuable asset in a trader’s toolbox.
Momentum refers to the rate of acceleration of a price or market trend. It measures the strength or weakness of the price movement in a given period of time. Momentum can be calculated using various technical indicators such as the relative strength index (RSI), moving averages, and the momentum meter indicator.

Market momentum, on the other hand, refers to the overall strength or weakness of a market. It reflects the collective sentiment and buying or selling pressure in the market. Market momentum can be bullish, indicating a strong upward trend, or bearish, indicating a strong downward trend.
Understanding market momentum is crucial for traders and investors as it helps them gauge the current market conditions and make informed decisions. By analyzing market momentum, traders can identify potential turning points, trends, and trading opportunities.
The momentum meter indicator is a tool that helps traders measure market momentum on a scale from -100 to +100. It takes into account different factors such as price movement, volume, and market breadth. A positive reading on the momentum meter indicates bullish market momentum, while a negative reading indicates bearish market momentum.
Traders can use the momentum meter indicator in various ways. For example, they can use it to confirm the strength of an existing trend or to identify potential trend reversals. By comparing the momentum meter readings with price action and other technical indicators, traders can gain valuable insights into market conditions and make more accurate predictions.
Read Also: Is IQ Option broker safe? Find out the truth here
| Advantages of Using the Momentum Meter Indicator |
|---|
| 1. It provides a clear and concise measure of market momentum. |
| 2. It helps traders identify overbought and oversold conditions. |
| 3. It can be used in conjunction with other technical indicators for better analysis. |
| 4. It helps traders make more accurate predictions and improve their trading strategies. |
In conclusion, understanding momentum and market momentum is crucial for successful trading. The momentum meter indicator is a valuable tool that helps traders measure market momentum and make informed decisions. By using this indicator in conjunction with other technical analysis tools, traders can gain a deeper understanding of market conditions and improve their trading strategies.
The momentum meter indicator is a popular technical analysis tool used by traders to measure the strength and velocity of price movements. It is based on the concept of momentum, which refers to the rate of change of price over a specified period of time.
The momentum meter indicator calculates the difference between the current price and the price a certain number of periods ago, and then presents this information in the form of a line or histogram. If the momentum meter line moves above a certain level, it can be interpreted as a sign of upward momentum, while a move below a certain level suggests downward momentum.
Read Also: How to Calculate a 2-Year Moving Average: Step-by-Step Guide
Traders use the momentum meter indicator to identify potential trend reversals or confirm existing trends. For example, if the price of an asset is in an uptrend but the momentum meter starts to decline, it could signal that a trend reversal is imminent. On the other hand, if the price is in a downtrend and the momentum meter starts to rise, it could indicate that the downtrend is losing strength.
The momentum meter indicator can also be used to generate trading signals. Traders may look for crossovers or divergences between the momentum meter line and the price chart to identify potential buying or selling opportunities. For example, a bullish crossover occurs when the momentum meter line crosses above a certain level, while a bearish crossover occurs when it crosses below a certain level.
It is important to note that the momentum meter indicator is not a standalone tool and should be used in combination with other technical analysis tools and indicators to make informed trading decisions. It is also recommended to adjust the parameters of the indicator to suit the specific market and time frame being analyzed.
In conclusion, the momentum meter indicator is a valuable tool for traders that helps measure the strength and velocity of price movements. By understanding how it works and how to use it effectively, traders can gain a better understanding of market trends and make more informed trading decisions.

The Momentum Meter Indicator is a technical analysis tool that measures the rate of change in a security’s price over a specific period of time. It helps traders identify whether a security is overbought or oversold and can be used to confirm trend reversals or signal potential entry points.
The Momentum Meter Indicator works by calculating the difference between the current price and the price n periods ago, and then plotting this difference on a chart. Positive values indicate upward momentum, while negative values indicate downward momentum. The indicator is typically displayed as a line that fluctuates above and below a zero line.
The Momentum Meter Indicator can be used to identify overbought and oversold conditions by looking for extreme values. When the indicator reaches a high level, above a certain threshold, it suggests that the security is overbought and a reversal or a correction may be imminent. Conversely, when the indicator reaches a low level, below a certain threshold, it suggests that the security is oversold and a rebound may be imminent.
While the Momentum Meter Indicator can be used as a standalone trading strategy, it is often used in conjunction with other technical analysis tools to confirm signals. For example, traders may use the indicator to identify potential entry points, and then use other indicators, such as moving averages or trendlines, to confirm the trade.
Some limitations of the Momentum Meter Indicator include its tendency to generate false signals in choppy or sideways markets. Additionally, the indicator may also lag behind the price action, especially during periods of high volatility. Therefore, it is important for traders to use the Momentum Meter Indicator in conjunction with other tools and take into account the overall market conditions.

Are Santander and WBK the same? When it comes to banking, there are numerous institutions that vie for customers’ attention. Two prominent names in …
Read Article
What is a good salary in Dubai? Dubai is known for its luxurious lifestyle, iconic skyscrapers, and bustling business scene. With its thriving economy …
Read Article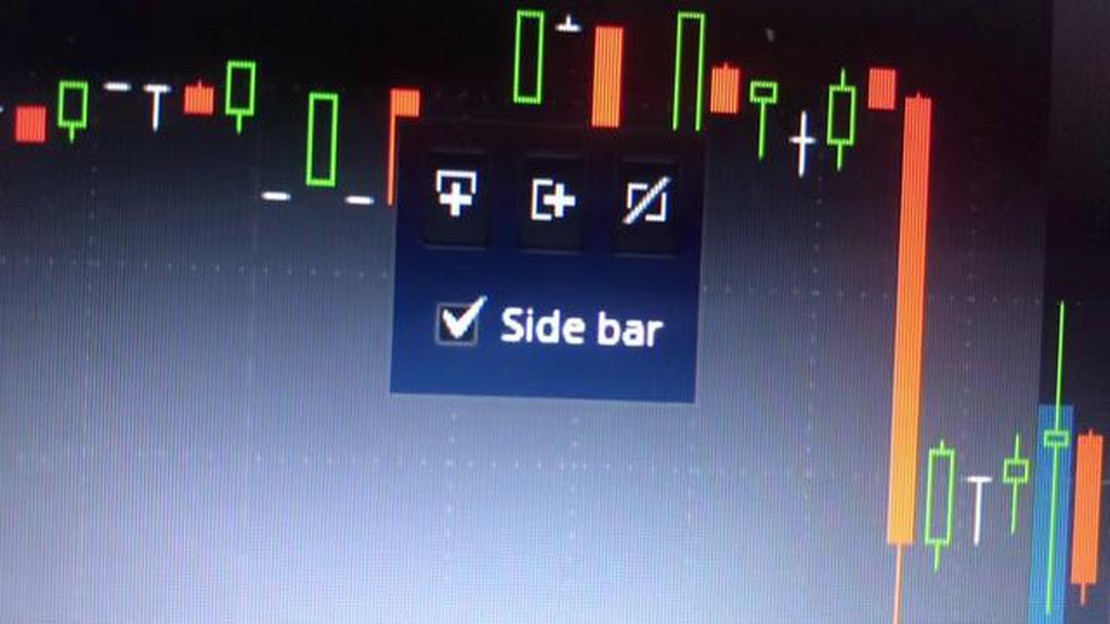
How to remove the side bar on Think or Swim If you use Think or Swim for your trading needs, you may have noticed a side bar that takes up precious …
Read Article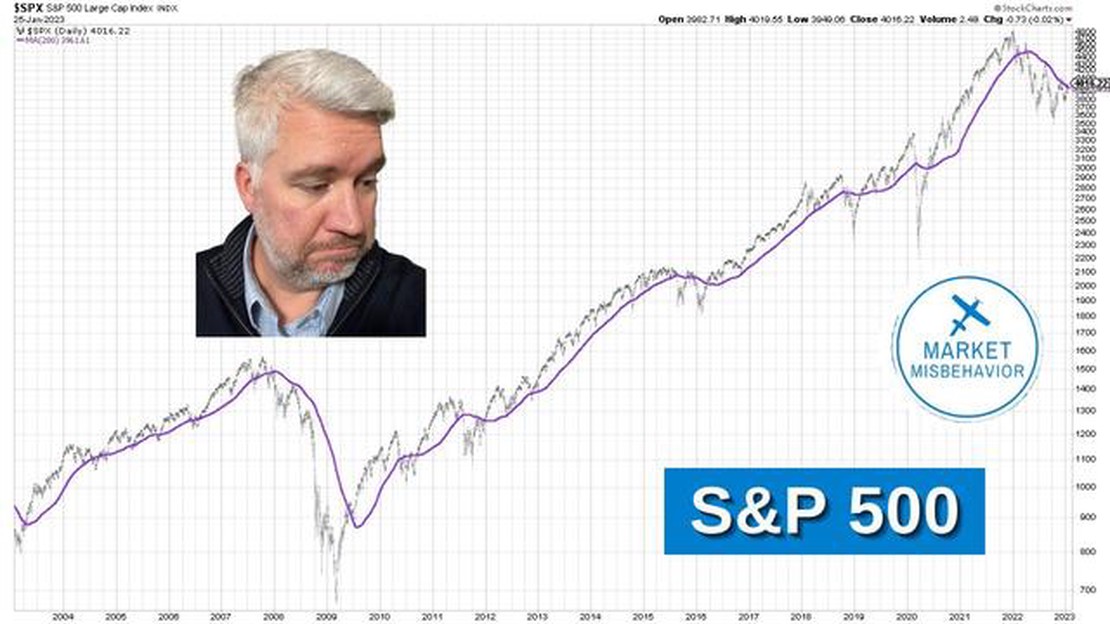
Understanding the Significance of the 200-Day Moving Average for the S&P 500 The 200-day moving average (MA) of the S&P is a commonly used technical …
Read Article
Who can issue stock options? Stock options are a popular form of employee compensation that grants workers the right to purchase company stock at a …
Read Article
Where can I download forex historical data? Forex historical data plays a vital role in analyzing the market, backtesting strategies, and making …
Read Article


