

Understanding the Spatial Mean in ArcGIS: Definition and Applications
What is the spatial mean in ArcGIS? The concept of the spatial mean is a fundamental aspect of spatial analysis in ArcGIS, a powerful geographic …
Read Article
When it comes to developing successful trading strategies, understanding the Moving Average method can be a game changer. This widely used technical analysis tool can help traders identify trends, predict future price movements, and make informed trading decisions. In this article, we will explore what the Moving Average method is, how it works, and how it can improve your overall trading strategy.
The Moving Average method is a mathematical calculation that helps traders analyze the historical price data of an asset over a specific period of time. It is based on the average price of the asset over a set number of periods, with each data point given equal weight. By calculating the Moving Average, traders can smooth out the price fluctuations and identify the underlying trend.
So, how does the Moving Average method work? Traders can choose different timeframes for calculating the Moving Average, depending on their trading goals and preferred trading style. A shorter timeframe, such as a 5-day Moving Average, provides a more responsive indicator that closely follows the price movements. On the other hand, a longer timeframe, such as a 50-day Moving Average, provides a smoother and less volatile indicator that captures the long-term trend.
By comparing the current price of the asset to its Moving Average, traders can generate trading signals. When the price crosses above the Moving Average, it is considered a bullish signal, indicating a potential uptrend. Conversely, when the price crosses below the Moving Average, it is considered a bearish signal, indicating a potential downtrend.
The Moving Average method can significantly improve your trading strategy by providing you with valuable information about the trend and potential reversals. It helps traders filter out market noise, identify high-probability trading opportunities, and manage risk more effectively. Additionally, the Moving Average method can be combined with other technical indicators and chart patterns to generate more accurate and reliable trading signals.
In conclusion, understanding the Moving Average method is essential for any trader who wants to enhance their trading strategy. By analyzing the historical price data and identifying trends, the Moving Average method can help you make better-informed trading decisions and increase your overall profitability. Whether you are a beginner or an experienced trader, integrating the Moving Average method into your trading toolbox is undoubtedly a wise move.
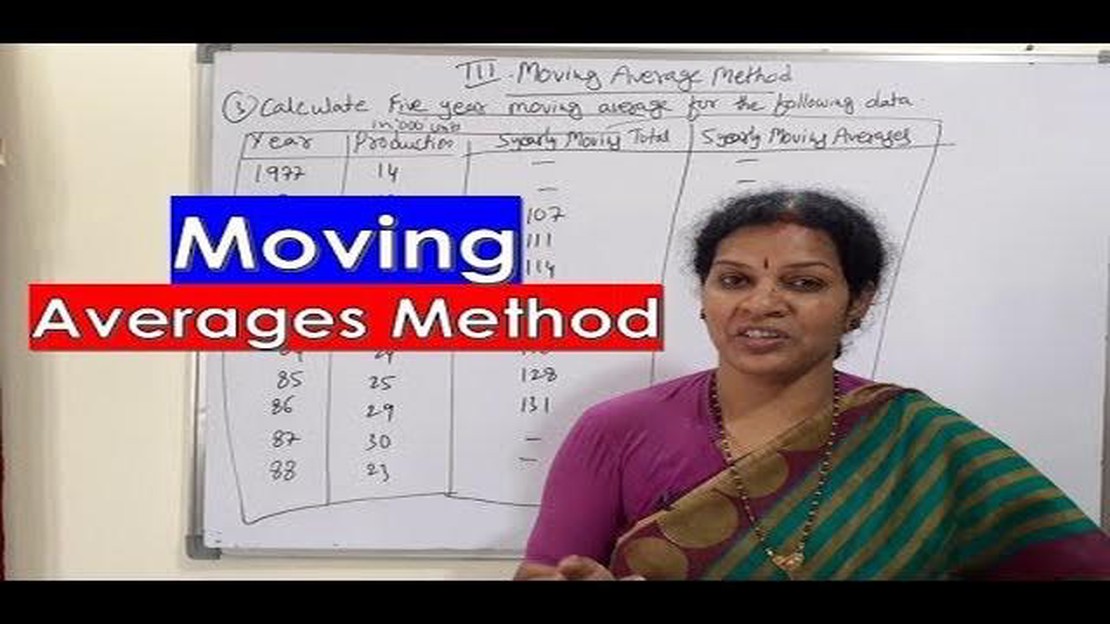
The moving average method is a commonly used technical analysis tool in trading. It helps traders identify trends and make informed trading decisions. The method calculates the average price of a security over a specific period of time, which helps traders filter out short-term price fluctuations and focus on the overall trend.
To calculate the moving average, you need to choose a time period, such as 50 days or 200 days, and calculate the average closing price for that period. As each new trading day passes, the oldest price in the calculation is dropped, and the newest price is added. This creates a continuous moving average line that can be plotted on a price chart alongside the actual price of the security.
The moving average line smooths out the price data, reducing the impact of random price fluctuations. It provides traders with a clearer picture of the overall trend by revealing the direction in which the price is moving. When the price is above the moving average, it suggests a bullish trend, while a price below the moving average indicates a bearish trend.

In addition to determining the trend, the moving average method also helps traders identify support and resistance levels. When the price approaches the moving average line, it often acts as a support or resistance level, causing the price to bounce off or reverse direction.
Traders use different types of moving averages, such as simple moving averages (SMA) and exponential moving averages (EMA), depending on their trading strategy and preference. SMAs give equal weight to each price point in the calculation, while EMAs give more weight to recent prices, making them more responsive to price changes.
Read Also: Malaysia to Pakistan Currency Exchange: How much is $1 in Pakistani Rupees?
Overall, the moving average method is a versatile tool that can be used in various trading strategies to improve decision-making. It provides traders with a clearer understanding of the market trend and helps them identify potential entry and exit points. However, it’s important to note that no trading strategy is foolproof, and it’s always recommended to use additional indicators and analysis techniques to confirm signals generated by the moving average method.
The moving average method is a popular tool used by traders to analyze trends and predict future market movements. It offers several benefits that can help improve your trading strategy.
1. Trend Identification: The moving average method helps identify trends in the market. By calculating the average price over a specific period, it smoothes out price fluctuations and makes it easier to identify the direction of the market. This can be useful in determining whether to go long or short on a particular asset.
2. Support and Resistance Levels: Moving averages can act as support or resistance levels for prices. When the price is moving above the moving average, it can act as a support level, indicating that the price may continue to rise. Conversely, when the price is moving below the moving average, it can act as a resistance level, suggesting that the price may decline.
3. Entry and Exit Points: The moving average method can help determine optimal entry and exit points for trades. For example, a trader may use the crossover of two moving averages as a signal to enter a trade. When the shorter-term moving average crosses above the longer-term moving average, it may indicate a buy signal. Conversely, when the shorter-term moving average crosses below the longer-term moving average, it may indicate a sell signal.
4. Confirmation of Market Signals: Moving averages can be used to confirm other technical indicators or market signals. For instance, if a trader sees a bullish candlestick pattern forming and the price is also above the moving average, it may provide additional confirmation that the market is likely to move higher.
Read Also: Comparing NR4 and NR7: Which one is better?
5. Risk Management: The moving average method can help manage risk by setting stop-loss orders. Traders can place a stop-loss order below the moving average to limit potential losses if the market moves against their position. This allows traders to cut their losses and protect their capital.
In conclusion, the moving average method offers several benefits that can improve your trading strategy. It helps identify trends, determine support and resistance levels, pinpoint entry and exit points, confirm market signals, and manage risk. By incorporating the moving average method into your trading strategy, you can increase your chances of making profitable trades in the financial markets.

The moving average method is a technical analysis tool used to identify trends in financial markets. It calculates the average price of a security over a specific period of time and plots it on a chart to smooth out price fluctuations and help traders identify the direction of the trend.
The moving average method works by calculating the average price of a security over a specific time period, such as 10 days or 50 days. The average is updated as new data becomes available, and traders use the moving average to identify the direction of the trend. When the price is above the moving average, it is considered a bullish signal, and when the price is below the moving average, it is considered a bearish signal.
Yes, the moving average method can improve your trading strategy. By using moving averages, you can filter out market noise and focus on the overall trend of the market. This can help you make more informed trading decisions and increase your chances of success.
There are several types of moving averages, including the simple moving average (SMA), the exponential moving average (EMA), and the weighted moving average (WMA). The SMA gives equal weight to each data point, while the EMA gives more weight to recent data. The WMA gives more weight to the most recent data points as well, but it also incorporates a weighted factor based on the time period.
You can use the moving average method in your trading strategy by looking for crossovers between different moving averages. For example, when a shorter-term moving average crosses above a longer-term moving average, it can be a bullish signal, indicating that it may be a good time to buy. Conversely, when a shorter-term moving average crosses below a longer-term moving average, it can be a bearish signal, indicating that it may be a good time to sell.
The moving average method is a popular technical analysis tool used by traders to determine the overall direction of a trend. It calculates the average price of a security over a specific period of time and plots it as a line on a chart. This line smooths out the price data and helps traders identify potential buying and selling opportunities.
The moving average method works by calculating the average price of a security over a specific time period. For example, a 50-day moving average would calculate the average price of a security over the past 50 days. This average is then plotted as a line on a chart, which helps traders identify the overall trend of the security. When the price is above the moving average, it is considered bullish, and when the price is below the moving average, it is considered bearish.

What is the spatial mean in ArcGIS? The concept of the spatial mean is a fundamental aspect of spatial analysis in ArcGIS, a powerful geographic …
Read Article
Understanding Stock Market Eye: The Ultimate Guide for Beginners If you are interested in investing or trading in the stock market, having a clear …
Read Article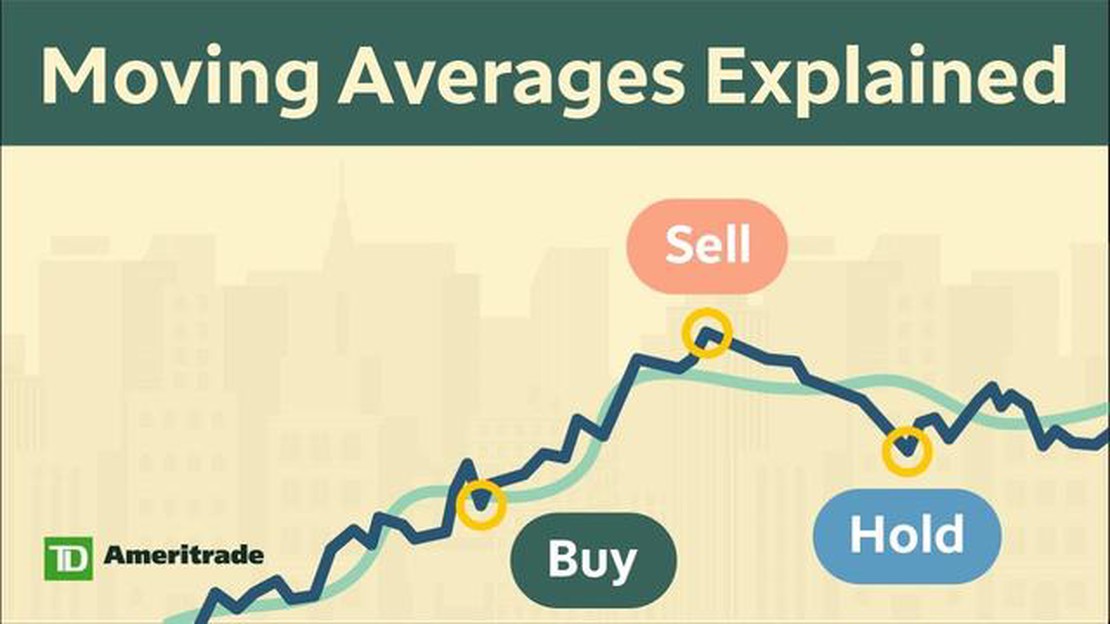
Understanding Moving Averages: Examples and Benefits A moving average is a statistical calculation used to analyze data over a certain period of time. …
Read Article
What is the optimal time frame for the OBV indicator? The On-Balance Volume (OBV) indicator is a popular tool used by traders to analyze the flow of …
Read Article
Trading Options Before Earnings: Pros and Cons Earnings season is a highly anticipated time for both investors and traders. It is during this period …
Read Article
Understanding the 50 200 Moving Average Crossover Strategy The moving average crossover strategy is a popular trading technique used by both beginner …
Read Article


