

What Happens to Options at the Money? Understanding At-The-Money Options
What happens to options at the money? At-the-money options are a key concept in the world of options trading. In simple terms, an at-the-money option …
Read Article
The moving average crossover strategy is a popular trading technique used by both beginner and experienced traders. It is a simple yet effective way to identify potential buy and sell signals in the market.
The strategy involves using two moving averages: the 50-day moving average and the 200-day moving average. The 50-day moving average represents the short-term trend, while the 200-day moving average represents the long-term trend. When these two moving averages cross over each other, it can signal a change in the trend and provide an opportunity for traders to enter or exit positions.
This strategy is based on the idea that when the short-term moving average crosses above the long-term moving average, it indicates a bullish trend and is a buy signal. Conversely, when the short-term moving average crosses below the long-term moving average, it indicates a bearish trend and is a sell signal.
Many traders find this strategy useful because it helps them to filter out market noise and focus on the overall direction of the trend. By using these two moving averages, traders can capitalize on the potential profits that can be made from larger market moves.
It is important to note that this strategy is not foolproof and should be used in conjunction with other technical indicators and analysis. Traders should also consider factors such as market volatility, volume, and news events that may impact the effectiveness of this strategy.
Overall, the 50 and 200 moving average crossover strategy is a powerful tool in a trader’s toolbox. It can help identify potential trends and provide entry and exit signals. However, like any trading strategy, it is important to practice risk management and thoroughly analyze the market before making any trading decisions.
The 50 and 200 moving average crossover strategy is a powerful tool for traders looking to identify trends and make profitable trades in the financial markets. This strategy combines two popular technical indicators, the 50-day moving average (MA) and the 200-day MA, to generate trading signals.

The 50-day MA represents the average of the closing prices over the past 50 trading days, while the 200-day MA calculates the average over the past 200 trading days. By comparing these two moving averages, traders can gain insights into the overall market trend. When the 50-day MA crosses above the 200-day MA, it is considered a bullish signal, indicating that the market is moving higher. Conversely, when the 50-day MA crosses below the 200-day MA, it is seen as a bearish signal, suggesting that the market is moving lower.
This strategy is especially effective in trending markets, where the price is consistently moving in one direction. Traders can use the moving average crossover signals to enter or exit trades, depending on their trading strategy. For example, if a trader is looking to go long on a stock, they may wait for the 50-day MA to cross above the 200-day MA before entering a buy trade. On the other hand, if a trader wants to go short on a stock, they may wait for the 50-day MA to cross below the 200-day MA before entering a sell trade.
Read Also: Understanding Trading Alerts: What They Are and How They Work
It is important to note that the moving average crossover strategy is not foolproof and should be used in conjunction with other forms of technical analysis and risk management techniques. False signals can occur, especially in volatile and choppy markets. Traders should also consider the overall market conditions and fundamental factors that may impact the stock or asset they are trading.
Furthermore, traders can customize the moving average crossover strategy to suit their trading style and preferences. For example, some traders may choose to use a shorter time frame, such as the 20-day MA, in combination with the 200-day MA for more frequent signals. Others may use additional technical indicators, such as the relative strength index (RSI) or stochastic oscillator, to confirm the moving average crossover signals.
In conclusion, the 50 and 200 moving average crossover strategy is a versatile tool that can help traders identify trends and make profitable trades. By mastering this strategy and combining it with other technical analysis techniques, traders can unleash its power and increase their chances of success in the financial markets.
The moving average is a commonly used technical indicator in financial markets. It is a mathematical calculation that helps traders and investors to identify the overall trend of an asset’s price over a specified period of time. The moving average is calculated by taking the average of a series of data points, such as closing prices, over a defined number of periods.
There are two main types of moving averages: the simple moving average (SMA) and the exponential moving average (EMA). The SMA gives equal weightage to each data point in the series, while the EMA gives more weightage to recent data points.
Traders use the moving average as a tool to filter out noise and identify the underlying trend of a security. When the price is above the moving average, it is considered to be in an uptrend, and when the price is below the moving average, it is considered to be in a downtrend.
Read Also: Examples of Predictive Analytics: A Comprehensive Guide
Furthermore, moving averages can also act as support and resistance levels. In an uptrend, the moving average can act as a support level where buyers tend to enter the market. In a downtrend, the moving average can act as a resistance level where sellers tend to enter the market.
One popular trading strategy that utilizes the moving average is the moving average crossover strategy. This strategy involves two moving averages: a shorter-term moving average and a longer-term moving average. When the shorter-term moving average crosses above the longer-term moving average, it generates a buy signal, and when the shorter-term moving average crosses below the longer-term moving average, it generates a sell signal.

Overall, the moving average is a versatile technical indicator that traders and investors use to analyze the trend and potential support and resistance levels of an asset’s price. It provides valuable insights into market sentiment and helps to guide trading decisions.
The 50 and 200 Moving Average Crossover Strategy is a trading strategy that involves the use of two moving averages - the 50-day moving average and the 200-day moving average. When the 50-day moving average crosses above the 200-day moving average, it is seen as a bullish signal, indicating that it may be a good time to buy. Conversely, when the 50-day moving average crosses below the 200-day moving average, it is seen as a bearish signal, indicating that it may be a good time to sell.
To calculate the 50 and 200-day moving averages, you need to add up the closing prices of the security over the given number of days (50 or 200) and divide it by the number of days. For example, to calculate the 50-day moving average, you would add up the closing prices of the security over the past 50 days and then divide it by 50. Similarly, to calculate the 200-day moving average, you would add up the closing prices of the security over the past 200 days and then divide it by 200.
The reliability of the 50 and 200 Moving Average Crossover Strategy can vary depending on market conditions and the specific security being traded. In trending markets, where the price is consistently moving in one direction, the strategy can be fairly reliable. However, in choppy or sideways markets, the strategy may generate false signals and be less reliable. It is important to consider other technical indicators and analyze the overall market environment before making trading decisions based solely on the moving average crossover signals.
Yes, the 50 and 200 Moving Average Crossover Strategy can be used in any market, including stocks, commodities, currencies, and indices. However, the effectiveness of the strategy may vary depending on the specific market and the characteristics of the security being traded. It is always important to conduct thorough research and analysis before implementing any trading strategy.

What happens to options at the money? At-the-money options are a key concept in the world of options trading. In simple terms, an at-the-money option …
Read Article
Why Forex Trading Is So Addictive Forex trading, also known as foreign exchange trading, has captivated the attention of millions of individuals …
Read Article
Do I need a mentor for trading? Trading in the financial markets can be a challenging and complex endeavor. It requires a deep understanding of …
Read Article
What Are the Disadvantages of ESPP? An Employees Stock Purchase Plan (ESPP) is a benefit offered by many companies that allows employees to purchase …
Read Article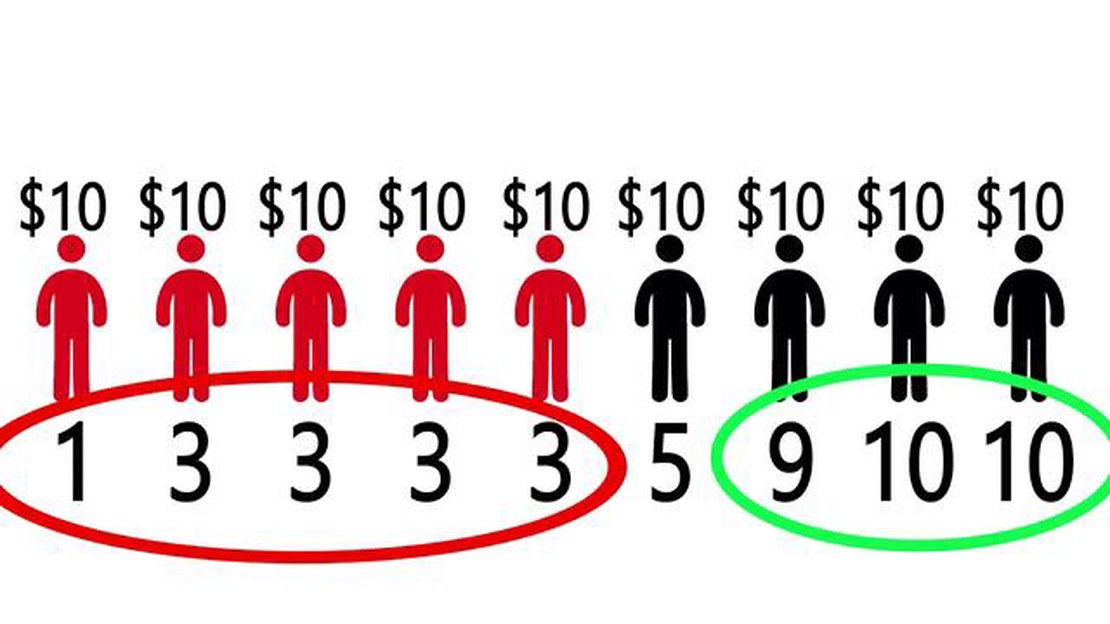
Advantages and Disadvantages of the Average of Averages The concept of using the average of averages is a common practice in statistical analysis, but …
Read Article
Understanding Stock Options for Pre-IPO Companies When it comes to working for a pre-IPO company, one of the key benefits that employees often receive …
Read Article


