


Can You Modify a Remington 870? | Exploring the Possibilities
Modifying a Remington 870: What You Need to Know If you’re a firearm enthusiast, you’ve probably heard of the Remington 870. It’s a popular …
Read Article
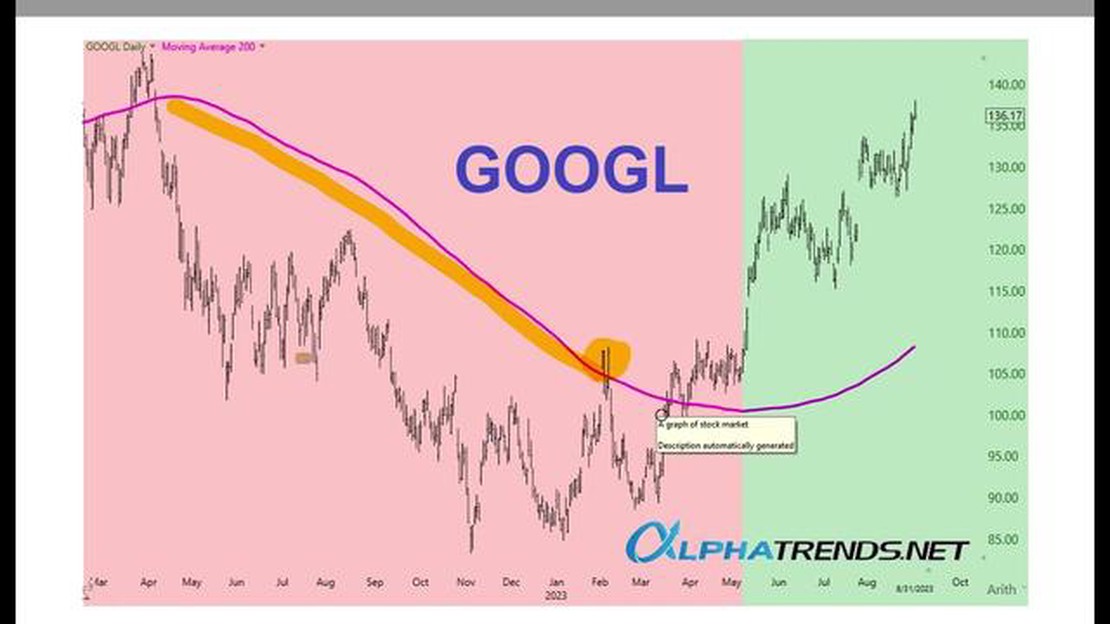
The 200-day moving average is a widely used technical analysis indicator in the financial markets. It is used by traders and investors to identify trends and potential reversals. The indicator calculates the average price of a security over the past 200 trading days, smoothing out short-term fluctuations and providing a clearer picture of the long-term trend.
Many analysts and traders believe that the 200-day moving average is a reliable indicator because it filters out noise and provides a more accurate representation of the underlying trend. When the price of a security is above its 200-day moving average, it is considered to be in an uptrend, and when the price is below the moving average, it is considered to be in a downtrend. This can help traders to determine the overall direction of the market and make more informed trading decisions.
However, it is important to note that the 200-day moving average is not infallible and should not be used as the sole basis for making investment decisions. Like any technical indicator, it has its limitations and can give false signals. For example, during periods of high volatility or market turbulence, the 200-day moving average may be less reliable as a trend indicator. It can also lag behind sudden price movements, causing traders to enter or exit positions too late.
Therefore, it is recommended to use the 200-day moving average in conjunction with other technical indicators and analysis tools to confirm signals and reduce the risk of false signals. Traders and investors should also consider fundamental factors and market conditions when making investment decisions. By combining different types of analysis, traders can increase their chances of success and improve their overall trading strategy.
In conclusion, the 200-day moving average is a widely used indicator in technical analysis, but it should not be solely relied upon for making investment decisions. While it can provide valuable insights into market trends, it is important to use it in conjunction with other tools and consider other factors before making trading decisions.
The 200-day moving average (MA) is a commonly used technical indicator in financial markets. It helps investors and traders in determining the overall trend of a security or market. However, like any other indicator, there are both pros and cons of using the 200-day MA. Let’s explore them below.

| Pros | Cons |
|---|---|
| 1. Simplicity: | 1. Lagging Indicator: |
| The 200-day MA is easy to calculate and understand, making it accessible to both beginner and experienced traders. | One of the main drawbacks of the 200-day MA is that it is a lagging indicator. It relies on past data, which means it may not always accurately reflect the current market conditions. |
| 2. Trend Identification: | 2. False Signals: |
| The 200-day MA helps in identifying the long-term trend of a security or market. It can be used to confirm or negate other technical indicators. | Due to its lagging nature, the 200-day MA can generate false signals. This means that a crossover or deviation from the indicator may not always result in a significant price movement. |
| 3. Support and Resistance Levels: | 3. Poor Performance in Range-Bound Markets: |
| The 200-day MA can act as a support or resistance level, influencing buying or selling decisions. | In range-bound markets, where prices move within a certain range, the 200-day MA may provide less reliable signals as it is designed to capture trending market conditions. |
| 4. Long-Term Perspective: | 4. Limited Use on Short-Term Charts: |
| The 200-day MA is commonly used by long-term investors as it helps in identifying major trends that may span over months or years. | On shorter timeframes, such as daily or intraday charts, the 200-day MA may not be as significant as other shorter-term moving averages. |
It’s important to remember that no single indicator should be used in isolation. The 200-day MA should be used in conjunction with other technical analysis tools and indicators to enhance the probability of making accurate trading decisions.
1. Trend identification: The 200-day moving average indicator is commonly used to identify the long-term trend in a financial instrument, such as a stock or an index. It smooths out short-term fluctuations and provides a clear picture of whether the price is moving upwards or downwards over a longer period of time.
Read Also: Choosing the Ideal Computer Setup for Successful Day Trading
2. Support and resistance levels: The 200-day moving average can act as a support or resistance level for the price of an asset. When the price crosses above the 200-day moving average, it is considered a bullish signal, indicating potential upward momentum. On the other hand, when the price crosses below the 200-day moving average, it is seen as a bearish signal, suggesting a potential downward trend.
3. Confirmation of trends: When the price of an asset is moving in the same direction as the 200-day moving average, it can provide confirmation that the trend is strong and likely to continue. This can be particularly useful for traders and investors looking for opportunities to enter or exit positions.
4. Widely used by market participants: The 200-day moving average is one of the most widely watched indicators among traders and investors. Its popularity makes it a self-fulfilling prophecy to some extent, as market participants tend to react to price movements around this indicator, leading to increased buying or selling pressure.
5. Long-term strategic planning: The 200-day moving average is often used by long-term investors to determine the overall health of a market or a specific stock. By analyzing the relationship between the price and the 200-day moving average, investors can make informed decisions about their long-term investment strategies.
6. Easy to calculate: The 200-day moving average is simple to calculate, as it only requires adding up the closing prices of the asset over the past 200 days and dividing by 200. This ease of calculation makes it accessible to a wide range of traders and investors, regardless of their technical analysis skills.
7. Smooths out volatility: The 200-day moving average helps to smooth out short-term price fluctuations and noise in the market, making it easier to identify the underlying trend. This can be particularly useful for traders who prefer to focus on longer-term trends rather than short-term fluctuations.
Read Also: Edmonton Oilers Trades: Find Out the Latest News and Updates
8. Works well in trending markets: The 200-day moving average works best in trending markets where there is a clear direction in prices. In such markets, it can help traders and investors stay on the right side of the trend and avoid false signals that may occur in choppy or sideways markets.
Overall, the 200-day moving average indicator has several advantages, such as trend identification, support and resistance levels, confirmation of trends, widespread usage, long-term planning, ease of calculation, volatility smoothing, and effectiveness in trending markets. However, it is important to note that no indicator is foolproof and should always be used in conjunction with other forms of analysis to make well-informed trading decisions.
The 200-day moving average is a technical analysis tool used to track the average price of an asset over the past 200 days.

The 200-day moving average is calculated by taking the average closing price of an asset over the past 200 trading days.
The 200-day moving average is considered a reliable indicator because it smooths out short-term price fluctuations and provides a longer-term trend. It is widely used by traders and investors to identify potential buy or sell signals.
Yes, the 200-day moving average can be used as a standalone indicator. It is often used to determine the overall trend of an asset. When the price is above the 200-day moving average, it is considered bullish, and when the price is below the 200-day moving average, it is considered bearish.
Yes, there are some limitations to using the 200-day moving average. It is a lagging indicator, which means it may not provide timely signals for short-term trading. Additionally, it may not be as effective in volatile or choppy market conditions.
The 200-day moving average is a technical indicator used by traders and investors to analyze the long-term trend of a financial asset. It is calculated by taking the average closing price of an asset over the past 200 trading days.

Modifying a Remington 870: What You Need to Know If you’re a firearm enthusiast, you’ve probably heard of the Remington 870. It’s a popular …
Read Article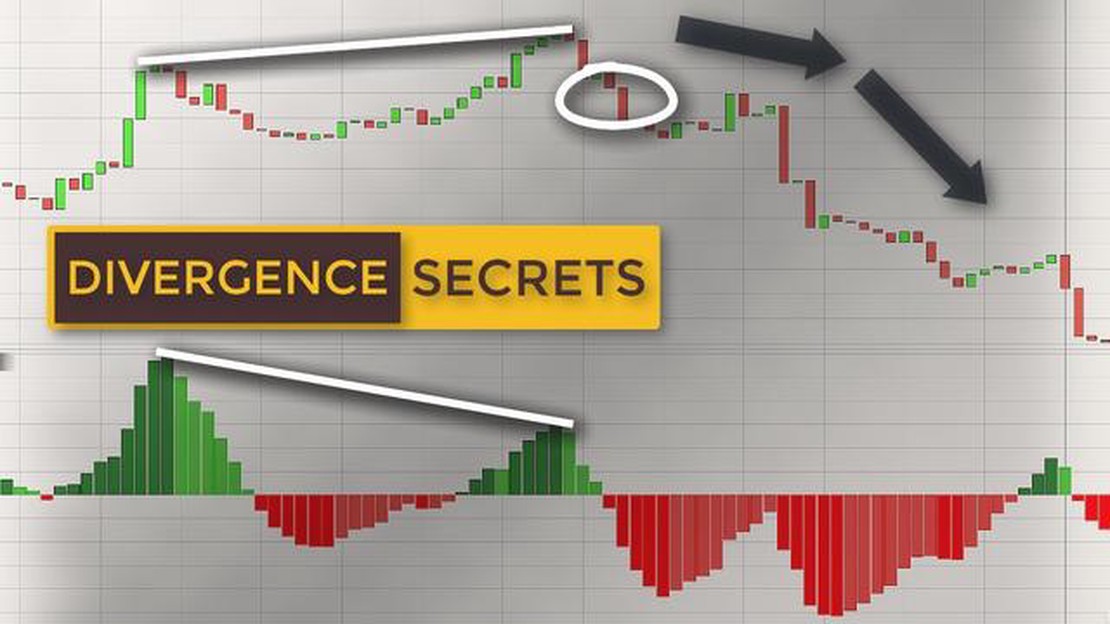
How to Identify Divergence with the Awesome Oscillator Divergence patterns can provide valuable insights into potential trend reversals in financial …
Read Article
Find the Most Affordable Method to Send Euros to Canada When it comes to sending money internationally, it is important to find the most …
Read Article
Is VW a good stock to buy? In the world of investing, choosing the right stocks can be a daunting task. With so many options available, it can be …
Read Article
Trade Forex the Halal Way: A Guide for Muslims Forex trading, also known as foreign exchange trading, is a popular financial market where individuals …
Read Article
Strategies for Learning Risk Management in Trading Trading can be a lucrative endeavor, but it also comes with its fair share of risk. To navigate the …
Read Article


