


Trading Futures at Night: Everything You Need to Know
Can I trade futures at night? Trading futures at night can be an intriguing and profitable venture for those who are willing to put in the time and …
Read Article
Divergence patterns can provide valuable insights into potential trend reversals in financial markets. By identifying discrepancies between price action and technical indicators, traders can anticipate changes in market direction and make more informed trading decisions.
One popular technical indicator for identifying divergence patterns is the Awesome Oscillator (AO). Developed by Bill Williams, the AO measures the momentum of a market by comparing the 34-period and 5-period simple moving averages. It displays this information in the form of histogram bars, with positive values indicating bullish momentum and negative values indicating bearish momentum.
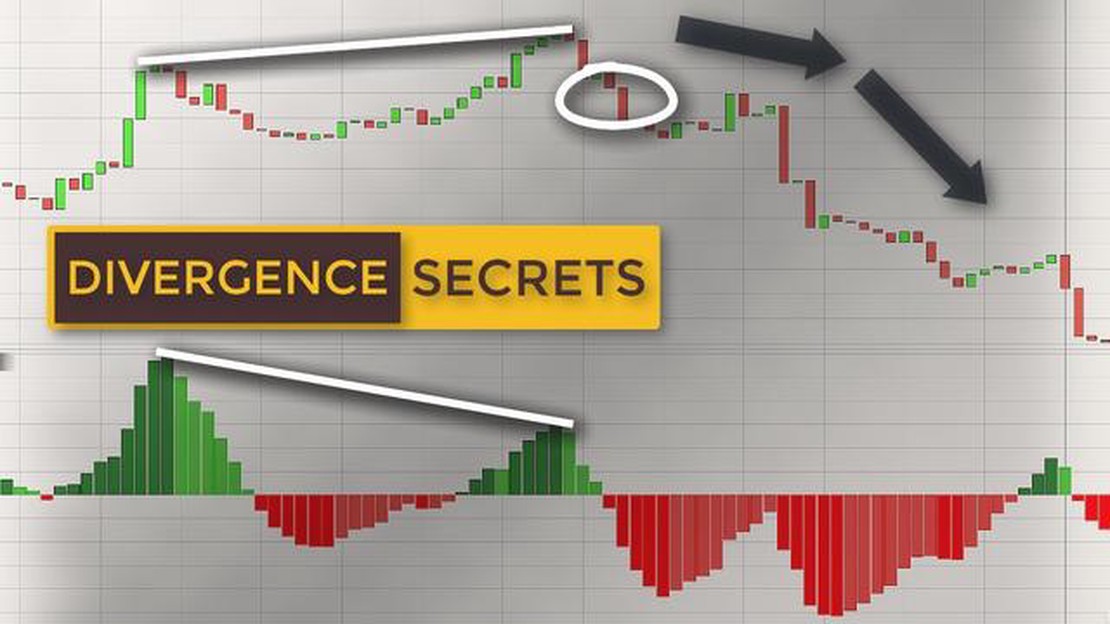
To identify divergence patterns using the Awesome Oscillator, traders should look for situations where the histogram bars are moving in the opposite direction to price action. This can indicate a weakening of the current trend and the potential for a reversal. There are two types of divergence patterns that traders commonly focus on: bullish divergence and bearish divergence.
Bullish divergence occurs when the price of an asset makes a lower low, while the Awesome Oscillator makes a higher low. This can suggest that bearish momentum is weakening and a bullish reversal may be imminent. Conversely, bearish divergence occurs when the price makes a higher high, while the Awesome Oscillator makes a lower high. This can indicate that bullish momentum is weakening and a bearish reversal may be on the horizon.
By identifying and interpreting divergence patterns using the Awesome Oscillator, traders can gain a better understanding of market dynamics and potentially improve their trading performance. However, it is important to note that no indicator is foolproof, and traders should always combine technical analysis with other tools and strategies to make well-informed trading decisions.
The Awesome Oscillator is a technical indicator that helps traders identify potential trend reversals or trend continuations. It is a histogram-based indicator that compares a security’s price momentum to its simple moving average over a specific period of time.
The indicator is derived from the difference between two simple moving averages of different lengths. The shorter moving average (usually 5 periods) is subtracted from the longer moving average (usually 34 periods) to create the histogram. The histogram is then plotted on a separate chart below the price chart.
The Awesome Oscillator histogram can have positive or negative values. When the histogram bars are above the zero line, it suggests that the momentum is bullish and the price might continue to rise. Conversely, when the histogram bars are below the zero line, it suggests that the momentum is bearish and the price might continue to fall.

Traders can also look for divergence patterns between the price and the Awesome Oscillator histogram. Divergence occurs when the price is moving in one direction while the Awesome Oscillator histogram is moving in the opposite direction. This can be a potential sign of trend reversal.
Overall, the Awesome Oscillator is a useful tool for traders to identify potential trend reversals or trend continuations. It can help traders make more informed trading decisions and improve their overall trading strategy.
Identifying divergence patterns in the price action is crucial for traders and investors as it can provide valuable insights into potential trend reversals or continuations. Divergence refers to a situation when the price of an asset moves in an opposite direction to a technical indicator, such as the Awesome Oscillator.
By recognizing and understanding divergence patterns, traders can gain a better understanding of market dynamics and make more informed and profitable trading decisions. Divergence patterns can signal potential trend reversals or continuations, helping traders to identify entry and exit points for trades. They can also provide early indications of potential price changes, allowing traders to position themselves advantageously in the market.
Read Also: Is $25,000 needed to trade options successfully?
Moreover, identifying divergence patterns can serve as a useful confirmation tool when combined with other technical indicators and analysis methods. It helps to validate the strength of a trend or the potential weakness in a trend, providing traders with additional confidence in their trading strategies.
Additionally, divergence patterns can be used in conjunction with other technical analysis tools, such as support and resistance levels, trend lines, or Fibonacci retracements. This multi-dimensional approach can enhance the effectiveness of traders’ strategies and increase their probabilities of making successful trades.
Read Also: What happens when you leave your forex position open overnight?
In summary, identifying divergence patterns is important for traders and investors as it provides valuable insights into potential trend reversals or continuations. By understanding and using these patterns effectively, traders can make more informed trading decisions, increase their profitability, and improve their overall trading strategies.
There are several methods that traders can use to identify divergence patterns using the Awesome Oscillator. These methods include:
Price and oscillator divergence: This method involves comparing the direction of price and the direction of the Awesome Oscillator. If price is making higher highs while the oscillator is making lower highs, or if price is making lower lows while the oscillator is making higher lows, then there is a divergence between the two. Traders can use these divergences to anticipate potential reversals in price.
Hidden divergence: Hidden divergences occur when there is a discrepancy between price and the Awesome Oscillator that suggests a continuation of the current trend. For example, if price is making lower lows while the oscillator is making higher lows, it indicates that the downtrend is likely to continue. Traders can use hidden divergences to confirm the strength of the current trend.

Regular divergence: Regular divergences occur when there is a discrepancy between price and the Awesome Oscillator that suggests a potential reversal in the current trend. For example, if price is making higher highs while the oscillator is making lower highs, it indicates that the uptrend is losing momentum and could reverse. Traders can use regular divergences to anticipate potential trend reversals.
Overall, the Awesome Oscillator is a useful tool for identifying divergence patterns in price and determining potential reversals or continuations in trends. By understanding and using these different methods of identifying divergence patterns, traders can improve their ability to make informed trading decisions.
The Awesome Oscillator is a popular technical indicator that is used to identify trends and potential reversals in the financial markets. It is based on the concept of the moving average, and it combines the values of two moving averages to produce a histogram that oscillates above and below a zero line.
The Awesome Oscillator can help in identifying divergence patterns by comparing the peaks and troughs on the histogram with the peaks and troughs on the price chart. Divergence occurs when the price is making higher highs or lower lows, but the histogram is making lower highs or higher lows. This can indicate a potential trend reversal.
There are two main types of divergence patterns that can be identified using the Awesome Oscillator: bullish divergence and bearish divergence. Bullish divergence occurs when the price is making lower lows, but the histogram is making higher lows. This can indicate a potential bullish reversal. Bearish divergence occurs when the price is making higher highs, but the histogram is making lower highs. This can indicate a potential bearish reversal.
Traders can use the information from divergence patterns identified using the Awesome Oscillator to make more informed trading decisions. For example, if a bullish divergence pattern is identified, it could be a signal to enter a long position or to exit a short position. Conversely, if a bearish divergence pattern is identified, it could be a signal to enter a short position or to exit a long position. However, it is important to note that divergence patterns alone should not be used as the sole basis for trading decisions, and other technical indicators and analysis should be considered as well.

Can I trade futures at night? Trading futures at night can be an intriguing and profitable venture for those who are willing to put in the time and …
Read Article
Trading Opportunities in a Rising Interest Rate Environment Interest rate changes can have a significant impact on the financial markets, and being …
Read Article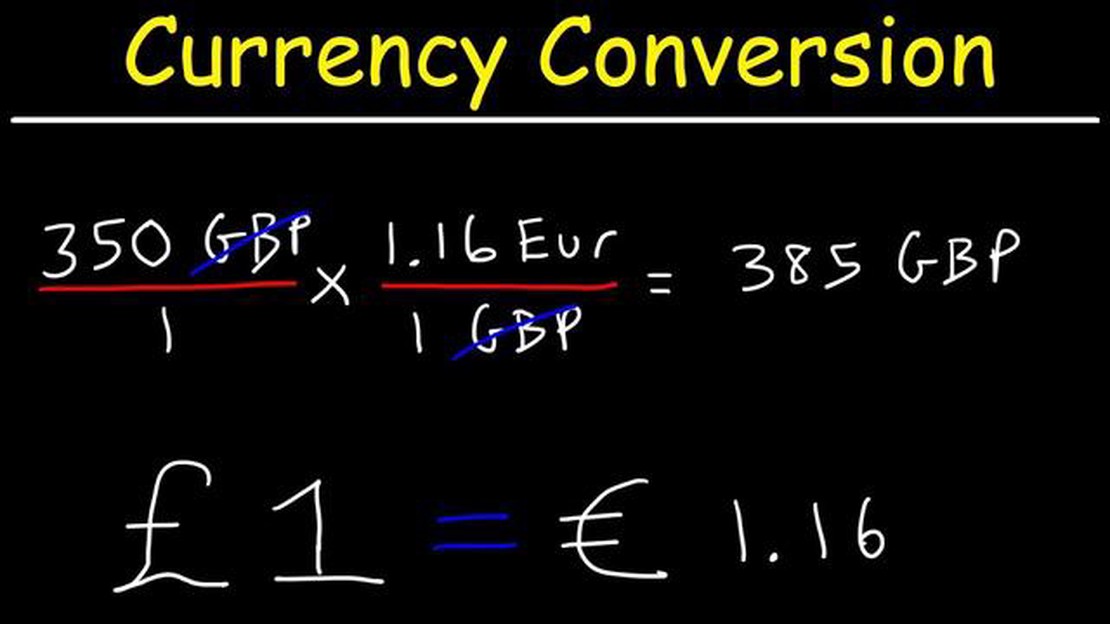
Zambia Dollar to Euro Exchange Rate: Current Conversion Rates and Updates The exchange rate of Zambia dollar to the euro is an important indicator for …
Read Article
Comparison of straddle, strangle, and other options strategies A straddle and a strangle are two popular options trading strategies that involve …
Read Article
What are the benefits of an employee stock purchase plan? Employee stock purchase plans (ESPPs) are an attractive benefit offered by many companies to …
Read Article
Reasons to Sell a Call Instead of Buying a Put When it comes to trading options, many investors focus on buying puts as a way to profit from a decline …
Read Article


