

Why Moving Average is Vital in Time Series Analysis
Understanding the Importance of Moving Average in Time Series Time series analysis is a crucial tool in predicting patterns and trends in data, …
Read Article

When it comes to trading the financial markets, having access to accurate and reliable data is essential. Candlestick charts have long been the preferred choice for many traders due to their ability to provide detailed information about price action. However, with so many different types of candle charts available, it can be overwhelming to choose the best one for your trading strategy.
In this comprehensive guide, we will explore the various types of candle charts available and help you understand their advantages and disadvantages. From the popular Japanese Candlestick chart to Heikin Ashi and Renko charts, we will break down each chart type and explain how they can be used to analyze price movements more effectively.
Not only will we cover the basic construction of each chart type, but we will also delve into more complex candle patterns and formations. By understanding these patterns, you will gain valuable insights into market trends and potential reversal points, empowering you to make more informed trading decisions.
Whether you are a beginner or an experienced trader, this guide will provide you with a comprehensive overview of the different candle charts available and help you choose the best one to support your trading style and strategy. By the end, you will have all the knowledge you need to confidently utilize candle charts and maximize your trading success.
Candlestick charts are a popular type of financial chart used by traders to analyze price movements and make informed trading decisions. They are visual representations of price data that provide valuable insights into market trends and potential price reversals.
Each candlestick on the chart represents a specific time period, such as a day, week, or hour, and consists of four main components: the open, high, low, and close prices. The body of the candlestick is represented by a rectangle, which is either filled or hollow. The top of the rectangle represents the highest price reached during the time period, while the bottom represents the lowest price. The color of the body indicates whether the closing price was higher or lower than the opening price. If the body is filled or black, it means that the closing price was lower than the opening price. If the body is hollow or white, it means that the closing price was higher than the opening price.
Candlestick charts are important for trading because they provide a wealth of information in a concise and easy-to-read format. Traders can quickly identify patterns and trends, such as bullish or bearish signals, using various candlestick formations. These formations, with names like doji, engulfing pattern, and hammer, can indicate potential price reversals or continuations of trends.
By analyzing candlestick charts, traders can make more informed decisions about when to enter or exit trades, set stop-loss orders, and identify potential areas of support and resistance. They can also use candlestick patterns in conjunction with other technical analysis tools, such as trend lines or moving averages, to confirm their trading strategies.
Overall, candlestick charts are an essential tool for traders of all levels, from beginners to experienced professionals. They provide valuable insights into market psychology, allowing traders to better understand supply and demand dynamics and gauge the sentiment of other market participants. By incorporating candlestick analysis into their trading strategies, traders can increase their chances of success and profitability in the financial markets.

There are several types of candlestick charts commonly used in trading. Each chart type has its own unique characteristics and advantages, making it suitable for different trading strategies. In this section, we will explore the most popular candlestick chart types and discuss their pros and cons.
| Candlestick Chart Type | Pros | Cons |
|---|---|---|
| Standard Candlestick Chart | * Provides valuable information on the open, high, low, and close prices for each period. |
When choosing a candlestick chart type, it’s essential to consider your trading strategy, time frame, and personal preferences. Experimenting with different chart types can help you find the one that suits your needs best and enhances your trading decisions.
Choosing the right candlestick chart for your trading strategy is crucial to your success as a trader. Candlestick charts provide essential visual representations of price action and can help you identify patterns and trends in the market.
Read Also: Step-by-Step Guide: Creating a Money Management Excel Sheet for Trading
Here are some factors to consider when selecting the best candlestick chart for your trading strategy:
1. Timeframe: Determine the timeframe that aligns with your trading strategy. Are you a day trader, swing trader, or long-term investor? Choose a candlestick chart that provides the right level of detail for your trading style.
Read Also: How long can you hold a stock option? | Insights and strategies
2. Candlestick Type: There are several types of candlestick charts available, including the standard candlestick chart, Heikin-Ashi chart, and Renko chart. Each chart type has its own advantages and disadvantages. Consider the specific features of each chart type and how they align with your trading strategy.
3. Indicators and Tools: Take into account the indicators and tools you use in your trading strategy. Make sure the candlestick chart you choose supports the indicators and tools you rely on for technical analysis.
4. Accuracy and Reliability: Look for a candlestick chart that provides accurate and reliable data. The quality of the data is crucial for making informed trading decisions. Consider using reputable charting platforms and data providers.
5. Customization: Consider the level of customization offered by the candlestick chart. Can you adjust the colors, timeframes, and other settings to suit your preferences? Customization can enhance your trading experience and make it easier to analyze the charts.

6. User-Friendliness: Choose a candlestick chart that is user-friendly and intuitive to navigate. A complicated charting interface can slow you down and make it difficult to identify trading opportunities. Look for charts with a clean layout and user-friendly features.
By considering these factors, you can choose the best candlestick chart for your trading strategy. Remember, finding the right chart is a personal choice, and it may take some experimentation to find the perfect fit for your trading style and preferences.
Candle charts are a type of financial chart used to represent the price movement of an asset over a specific period of time. They consist of individual “candles” that have a body and wicks, which represent the opening, closing, high, and low prices of the asset. The body of the candle is filled or hollow, depending on whether the closing price is lower or higher than the opening price. Candle charts provide valuable information about the momentum and direction of price movements.
Candle charts have several benefits for traders. Firstly, they provide visual representation of price movements, making it easier to understand and interpret market trends. Candle charts also offer more detailed information than other types of charts, such as line charts or bar charts, as they show the opening, closing, high, and low prices of each time period. This can help traders make more informed decisions and identify potential trading opportunities. Additionally, candle charts can be used in conjunction with other technical analysis tools to enhance trading strategies.
There are several types of candle charts commonly used in trading, including the basic candlestick chart, the Heikin-Ashi chart, and the Renko chart. The basic candlestick chart is the most widely used and provides detailed information about price movements. The Heikin-Ashi chart is a variation of the traditional candlestick chart that uses modified calculations to smoothen price data, making it easier to identify trends. The Renko chart is a type of chart that only takes into account price movements of a certain magnitude, disregarding time intervals. Each type of chart has its own advantages and can be used depending on the trader’s preference and trading strategy.
Choosing the best candle chart for your trading strategy depends on a few factors. Firstly, consider your level of experience and familiarity with different types of charts. If you are new to trading or prefer simplicity, the basic candlestick chart may be the best option. If you are more experienced and want to incorporate different types of analysis, you may consider using the Heikin-Ashi chart or Renko chart. Additionally, consider your trading strategy and objectives. Some charts may be better suited for short-term trading, while others are more suitable for long-term trading. It is important to test different charts and see which one works best for your specific needs.
Yes, candle charts can be used for various types of financial assets, including stocks, commodities, forex, and cryptocurrencies. The principles of candle chart analysis remain the same regardless of the asset being traded. However, it is important to consider the specific characteristics and volatility of the asset when interpreting candle charts. Different assets may have different patterns and trends, so it is essential to study and understand the behavior of the specific asset before making trading decisions.

Understanding the Importance of Moving Average in Time Series Time series analysis is a crucial tool in predicting patterns and trends in data, …
Read Article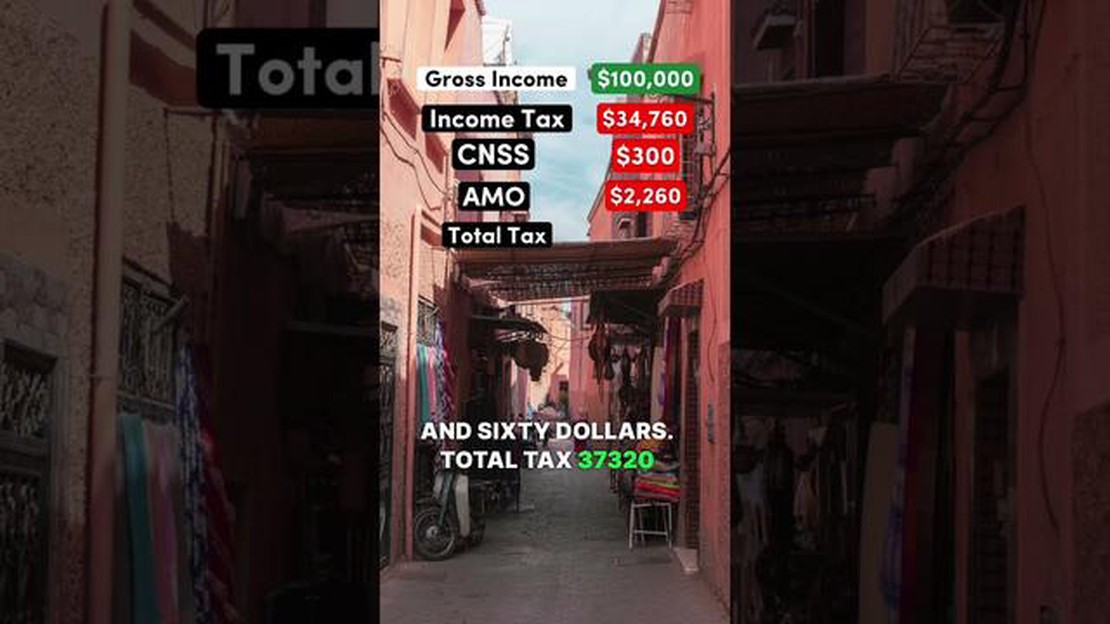
What is the salary of a trader in Morocco? Have you ever wondered how much traders in Morocco earn in the financial markets? Trading has become a …
Read Article
Does Nedbank offer forex services? Foreign exchange, or forex, trading is a popular investment option for individuals and businesses looking to profit …
Read Article
How Does Binary Pay? Binary pay is a compensation structure commonly used in the world of multi-level marketing (MLM) and direct sales. It is a system …
Read Article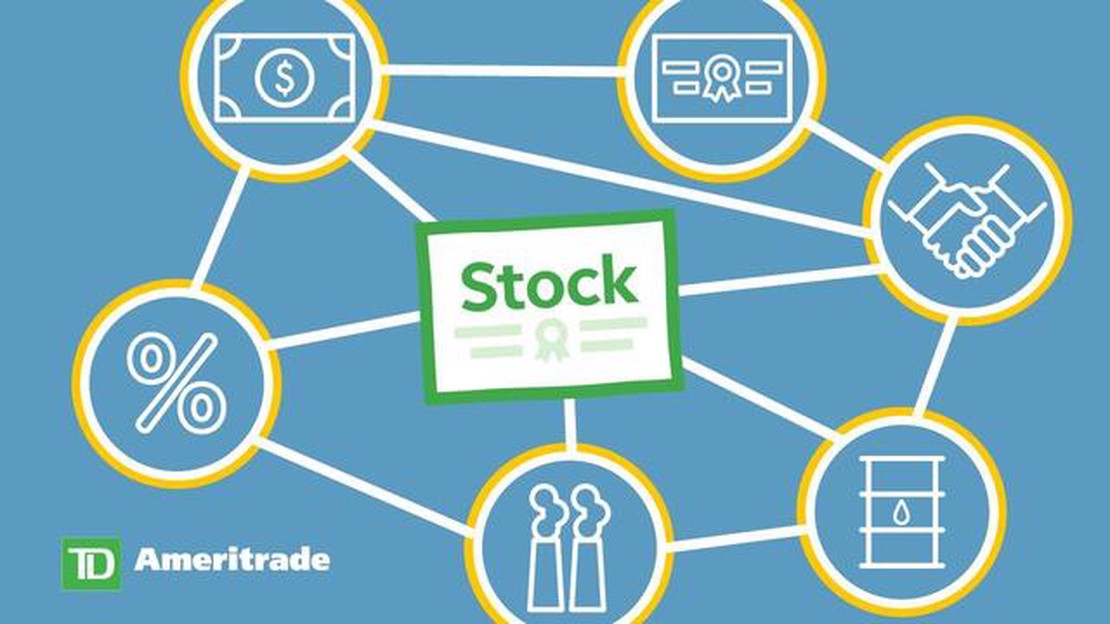
Understanding the Intermarket Trading System: Key Concepts and Benefits The Intermarket Trading System (ITS) is a complex network of interconnected …
Read Article
Understanding the Difference Between DD and NDD Brokers When it comes to forex trading, it is crucial to understand the difference between dealing …
Read Article


