


Understanding the Meaning of Clearing in Trading - All You Need to Know
The Meaning of Clearing in Trading Clearing is an essential process in the financial markets that ensures the smooth and efficient settlement of …
Read Article
A moving average is a statistical calculation used to analyze data over a certain period of time. It is commonly used in finance, economics, and data analysis to identify trends and patterns in data. The moving average smooths out fluctuations and helps to reveal underlying trends in the data.
To calculate a moving average, you take the average of a set of data points over a specific timeframe. As new data points are added, the calculations are updated to include the most recent data and remove the oldest data. This creates a “moving” average that adjusts over time.
There are different types of moving averages, such as simple moving averages (SMA) and exponential moving averages (EMA). A simple moving average gives equal weight to each data point, while an exponential moving average assigns more weight to recent data points.
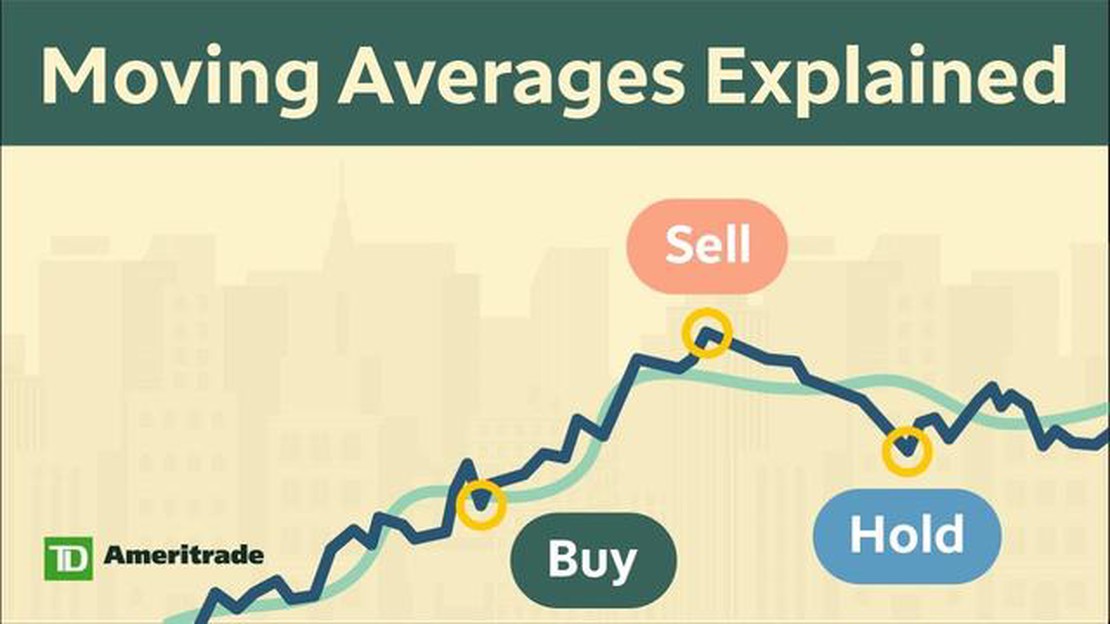
One example of using a moving average is in stock market analysis. Traders may use a moving average to identify potential buy or sell signals. For example, if the current price of a stock crosses above its 50-day moving average, it may indicate a bullish trend and a potential buying opportunity.
The benefits of using a moving average include its simplicity and ability to smooth out noise in the data. It helps to filter out short-term fluctuations and reveals the overall direction of the trend. By identifying trends, moving averages can be used to make informed decisions in various fields, from finance to marketing.
“The moving average is a powerful tool in data analysis that can enhance decision-making and improve forecasting accuracy.”
A moving average is a technical analysis tool that smooths out price data over a specified time period, allowing traders and investors to identify trends and potential buy or sell signals. It is commonly used to analyze stock, currency, and commodity markets.
The moving average is calculated by taking the average of a series of prices over a given time period. This time period, known as the lookback period, can vary depending on the user’s preference and the specific market being analyzed.
There are different types of moving averages, including simple moving averages (SMA) and exponential moving averages (EMA). A simple moving average gives equal weight to each data point in the lookback period, while an exponential moving average assigns more weight to recent data points.
The moving average can be plotted on a chart to visually represent the smoothed price data. It is often used in conjunction with other technical indicators, such as the relative strength index (RSI) or the moving average convergence divergence (MACD), to generate buy or sell signals.
| Type | Calculation | Weighting |
|---|---|---|
| Simple Moving Average (SMA) | Sum of prices / number of periods | Equal weight to each data point |
| Exponential Moving Average (EMA) | Current price * smoothing factor + previous EMA * (1 - smoothing factor) | More weight to recent data points |
By analyzing the slope and direction of the moving average line, traders can determine whether the market is in an uptrend or downtrend. A rising moving average indicates an uptrend, while a falling moving average suggests a downtrend.
Some benefits of using moving averages include:

A moving average is a popular technical analysis tool used to smooth out price data and identify trends over a specified period of time. There are different calculation methods for moving averages, including:
1. Simple Moving Average (SMA)
The simple moving average is calculated by adding together a predefined number of price data points and dividing the sum by the number of data points. This method gives equal weight to each data point in the calculation.
Read Also: Understanding CTM in Forex: A Comprehensive Guide
2. Weighted Moving Average (WMA)
The weighted moving average gives different weights to each data point in the calculation. Typically, more recent data points are given higher weights. The weighted moving average is calculated by multiplying each data point by its weight and summing them up, then dividing the sum by the total weight.
3. Exponential Moving Average (EMA)
The exponential moving average gives more weight to recent data points and less weight to older ones. It is calculated using a smoothing factor that is applied to the previous average and the current price data point. The exponential moving average adjusts more quickly to price changes compared to the simple and weighted moving averages.
4. Hull Moving Average (HMA)
The hull moving average is a relatively new type of moving average that aims to reduce lag and improve accuracy. It is based on a weighted sum of two different weighted moving averages. The hull moving average is designed to be more responsive to price movements while retaining the smoothness of a moving average.
5. Adaptive Moving Average (AMA)
The adaptive moving average adjusts the smoothing factor based on the volatility of the price data. It aims to be more responsive during periods of high volatility and less responsive during periods of low volatility. The adaptive moving average is calculated using a combination of exponential moving averages and a self-adjusting factor.
Read Also: Disadvantages of Weighted Moving Average: What You Need to Know
Each moving average calculation method has its own advantages and disadvantages. Traders and analysts use different moving averages depending on their trading strategies and preferences.
Disclaimer: The information provided here is for informational purposes only. It should not be considered as financial or investment advice. Consult with a professional financial advisor or conduct your own research before making any investment decisions.
Moving averages are a popular technical analysis tool used by traders and investors to identify trends and potential trading opportunities. Here are a few examples of how moving averages can be used in different ways:

Simple Moving Average (SMA): The SMA calculates the average of a given set of data points over a specified period of time. For example, a 50-day SMA would take the closing prices of the last 50 days and calculate their average. Traders use SMAs to determine the overall direction of a stock or market.
Exponential Moving Average (EMA): The EMA gives more weight to recent data points, making it more responsive to recent price changes. This can help traders identify trends before they are fully developed. For example, a 20-day EMA would give more weight to the prices of the last 20 days compared to the prices before that.
Signal Line: The signal line is a moving average that is used in conjunction with other indicators, such as the MACD (Moving Average Convergence Divergence). It helps traders confirm potential trend reversals or entry/exit points. The signal line is often a 9-day EMA.
Golden Cross and Death Cross: The golden cross occurs when a shorter-term moving average (e.g., 50-day SMA) crosses above a longer-term moving average (e.g., 200-day SMA). This cross is considered a bullish signal, indicating potential upward momentum. Conversely, the death cross occurs when the shorter-term moving average crosses below the longer-term moving average, signaling potential downward momentum.
Bollinger Bands: Bollinger Bands include a moving average (typically a 20-day SMA) and two standard deviation lines above and below the moving average. Traders use Bollinger Bands to identify periods of high or low volatility and potential trend reversals.
These are just a few examples of how moving averages can be used in technical analysis. Traders and investors often use them in combination with other indicators and strategies to make well-informed trading decisions.
A moving average is a statistical calculation that is used to analyze data over a certain period of time by continuously recalculating the average of the most recent data points.
A moving average is calculated by adding up the values of a set of data points over a specified period of time and dividing it by the number of data points in that period.
There are several different types of moving averages, including simple moving averages (SMA), exponential moving averages (EMA), and weighted moving averages (WMA). Each type of moving average is calculated differently and has its own advantages.
Some benefits of using moving averages include smoothing out data fluctuations, identifying trends, providing support and resistance levels, and generating trading signals.
Yes, moving averages can be used in various markets, including stocks, forex, commodities, and cryptocurrencies. They are a versatile tool for analyzing price movements and trends in any market.
A moving average is a widely used statistical tool that is used to analyze trends over a specific period of time. It is calculated by adding up a set number of data points and then dividing that sum by the number of points.

The Meaning of Clearing in Trading Clearing is an essential process in the financial markets that ensures the smooth and efficient settlement of …
Read Article
Exchange rate of the dollar to the euro The exchange rate between the dollar and euro is an important indicator of the economic relationship between …
Read Article
Where to Exchange Foreign Currency in NYC Planning a trip to the Big Apple? Whether you’re a tourist visiting New York City or a local planning to …
Read Article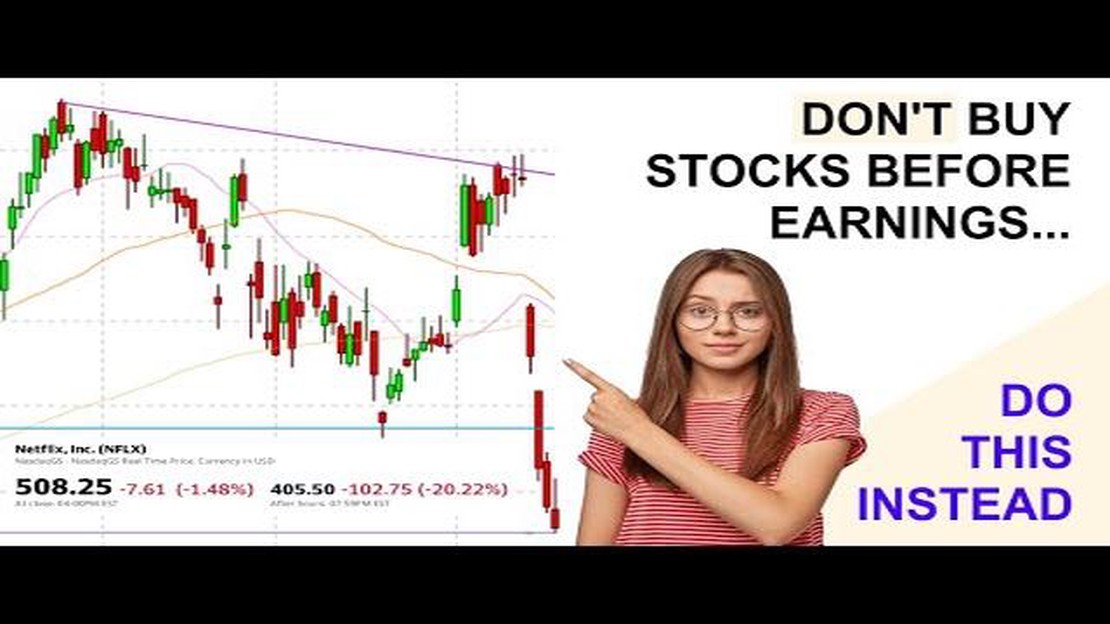
Should You Purchase Stocks Before an Earnings Call? Investing in stocks can be a risky endeavor, as the stock market is known for its volatility. One …
Read Article
Trading in Nairobi Stock Exchange: A Step-by-Step Guide Investing in the stock market can be an effective way to grow your wealth and achieve your …
Read Article
Can a bullish pinbar be red? A bullish pinbar is a popular candlestick pattern that is often used by traders to predict potential trend reversals in …
Read Article


