

Discover Whether a Bull Put Spread is a Buy or Sell Strategy
What is a Bull Put Spread: A Buy or Sell Strategy? A bull put spread is a popular options trading strategy that is used by investors who are bullish …
Read Article
The On-Balance Volume (OBV) indicator is a popular tool used by traders to analyze the flow of volume in a given market. By tracking the volume traded during up and down price movements, OBV helps traders identify potential trends and confirm the strength of a price move. One factor that can greatly impact the accuracy and effectiveness of the OBV indicator is the time frame used for analysis.
Choosing the right time frame for OBV analysis is crucial as it can greatly affect the indicator’s ability to capture meaningful volume patterns and signals. Different time frames can provide different perspectives on market trends and help traders identify opportunities on various scales.
Shorter time frames, such as intraday or hourly charts, can be useful for day traders looking to capture short-term price movements and volume trends. These time frames allow traders to analyze the OBV indicator’s signals in real-time and make quick decisions based on the volume flow.
On the other hand, longer time frames, such as daily or weekly charts, provide a broader view of market trends and can help traders identify long-term trends and reversals. By analyzing OBV data over a longer period of time, traders can gain insight into the overall volume flow and better understand the underlying market dynamics.
It’s important to note that there is no universally “best” time frame for OBV analysis. The optimal time frame will vary depending on the trader’s individual trading style, goals, and the specific market being analyzed. Traders are encouraged to experiment with different time frames and observe how the OBV indicator performs in each to find the most suitable time frame for their trading strategy.
In conclusion, the choice of time frame for OBV analysis is a key consideration for traders. It determines the granularity and scope of the volume data analyzed, which can significantly impact the accuracy and effectiveness of the OBV indicator. By carefully selecting the appropriate time frame, traders can enhance their ability to identify trends, reversals, and potential trading opportunities.
When using the On-Balance Volume (OBV) indicator, it is important to choose the right time frame in order to maximize its effectiveness. The OBV indicator is a momentum indicator that uses volume to predict price movements. It is based on the idea that volume precedes price, so changes in volume can signal potential changes in price direction.

There is no one-size-fits-all answer to what the best time frame is for the OBV indicator, as it largely depends on the specific trading strategy and personal preferences of the trader. However, there are some general guidelines that can be followed.
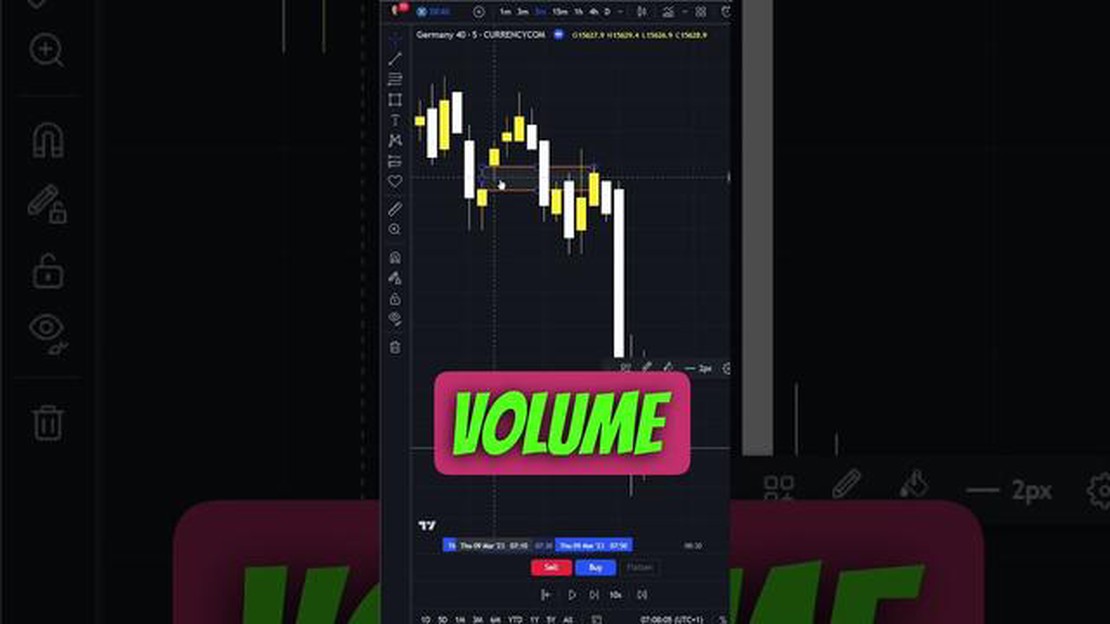
Short-term traders who prefer quick trades and are looking for smaller price movements may find that a shorter time frame, such as a 5-minute or 15-minute chart, works best for them. This allows them to capture short-term price changes and capitalize on market volatility.
Read Also: How many dollars is 100 pips? | Learn the value of 100 pips in dollars
On the other hand, long-term traders who are more interested in capturing larger price movements and are willing to hold positions for a longer period of time may opt for a longer time frame, such as a daily or weekly chart. This allows them to filter out short-term noise and focus on the overall trend.
For swing traders who are looking to capture medium-term price movements, a time frame in between the short-term and long-term time frames may be suitable. This could be a 1-hour or 4-hour chart, for example.
It is worth noting that the choice of time frame also depends on the market being traded. Different markets have different characteristics and may require different time frames to effectively analyze price and volume patterns.
In conclusion, there is no definitive answer to what the best time frame is for the OBV indicator. It ultimately depends on the specific trading strategy and preferences of the trader. Experimenting with different time frames and analyzing results can help identify the optimal time frame for using the OBV indicator in a given trading context.
The On-Balance Volume (OBV) indicator is a volume-based technical analysis tool that aims to measure the positive and negative flow of volume in a particular security or asset. It was developed by Joseph Granville and introduced in his 1963 book, “New Key to Stock Market Profits”.
The OBV indicator works on the principle that volume precedes price movement. It assumes that when volume increases significantly during an uptrend, it indicates the presence of strong buying pressure, which is likely to push the price higher. Conversely, when volume increases during a downtrend, it suggests strong selling pressure and the potential for further price declines.
The OBV indicator calculates its values by adding the volume on up days and subtracting the volume on down days. If the closing price is higher than the previous day’s closing price, the volume for that day is considered positive and added to the total OBV. If the closing price is lower, the volume is considered negative and subtracted from the total OBV. The resulting line is then plotted on a chart, creating a graphical representation of the OBV indicator.
Traders and analysts use the OBV indicator to confirm price trends and identify potential trend reversals. When the OBV line is increasing, it suggests buying pressure and a potentially bullish trend. Conversely, when the OBV line is decreasing, it indicates selling pressure and a potentially bearish trend. Divergences between the OBV line and price movements can also provide valuable insights into the strength of the ongoing trend.
Read Also: What is Stock Market Eye? A Comprehensive Guide
While the OBV indicator can be used on any time frame, it is commonly used on daily and weekly charts. Longer time frames tend to smooth out short-term fluctuations and provide a clearer view of the overall trend. Traders may also use shorter time frames, such as hourly or 15-minute charts, to identify intraday trends and trading opportunities.
It is important to note that the OBV indicator is not a standalone tool and should be used in conjunction with other technical analysis tools and indicators to confirm trading decisions. It is also recommended to backtest and analyze the indicator’s performance over different time frames to ensure its effectiveness in a specific trading strategy.

The On-Balance Volume (OBV) indicator is a technical analysis tool that uses volume and price to measure buying and selling pressure. It is used to confirm price trends and detect any potential reversals.
The OBV indicator works by adding the volume on up days and deducting the volume on down days. The cumulative total is then plotted on a chart. If the OBV line is moving up, it suggests that buying pressure is increasing, while a downward OBV line indicates increasing selling pressure.
The optimal time frame to use with the OBV indicator depends on the trading strategy and the market being analyzed. Shorter time frames, such as intraday charts, are more suitable for short-term traders, while longer time frames, such as daily or weekly charts, are better for long-term investors.
Yes, the OBV indicator can be used in conjunction with other technical indicators to enhance its effectiveness. Traders often use it along with moving averages, trend lines, and other oscillators to get a more comprehensive view of the market.
The effectiveness of the OBV indicator can vary depending on market conditions. It tends to work well in trending markets, where it can confirm the strength of the trend. However, in choppy or sideways markets, the OBV indicator may give false signals and should be used with caution.

What is a Bull Put Spread: A Buy or Sell Strategy? A bull put spread is a popular options trading strategy that is used by investors who are bullish …
Read Article
How much does Interactive Brokers charge for SPX options? Interactive Brokers is a popular online brokerage firm known for its low commission rates …
Read Article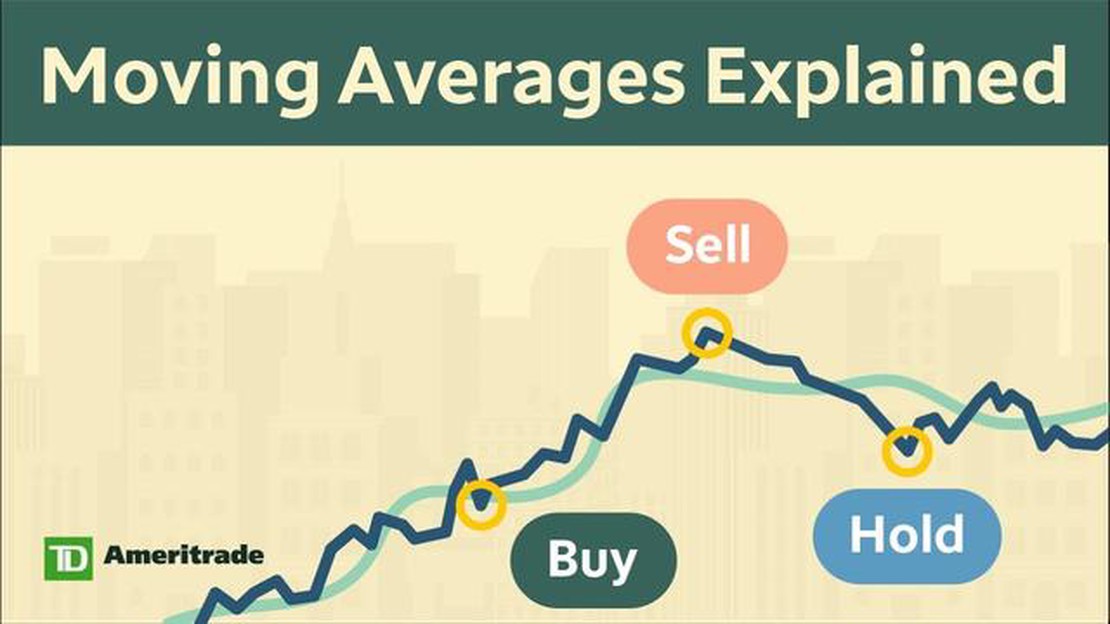
Understanding the 50-Day Moving Average for Silver The 50-day moving average is a widely used technical indicator that provides valuable insights into …
Read Article
Guide to Trading Forex in the USA Forex trading, also known as foreign exchange trading, is the buying and selling of currencies. It is a …
Read Article
What is the TSX index name? The TSX Index is one of the premier stock market indexes in Canada. It represents the performance of the top companies …
Read Article
How to Utilize the 8 and 21 Moving Average in Trading When it comes to trading, using moving averages can be a powerful tool. In particular, the 8 and …
Read Article


