

Understanding MT4 Commission: How it works and why it matters
What is commission in mt4? For traders in the foreign exchange market, MetaTrader 4 (MT4) is a widely used trading platform. It offers a variety of …
Read Article
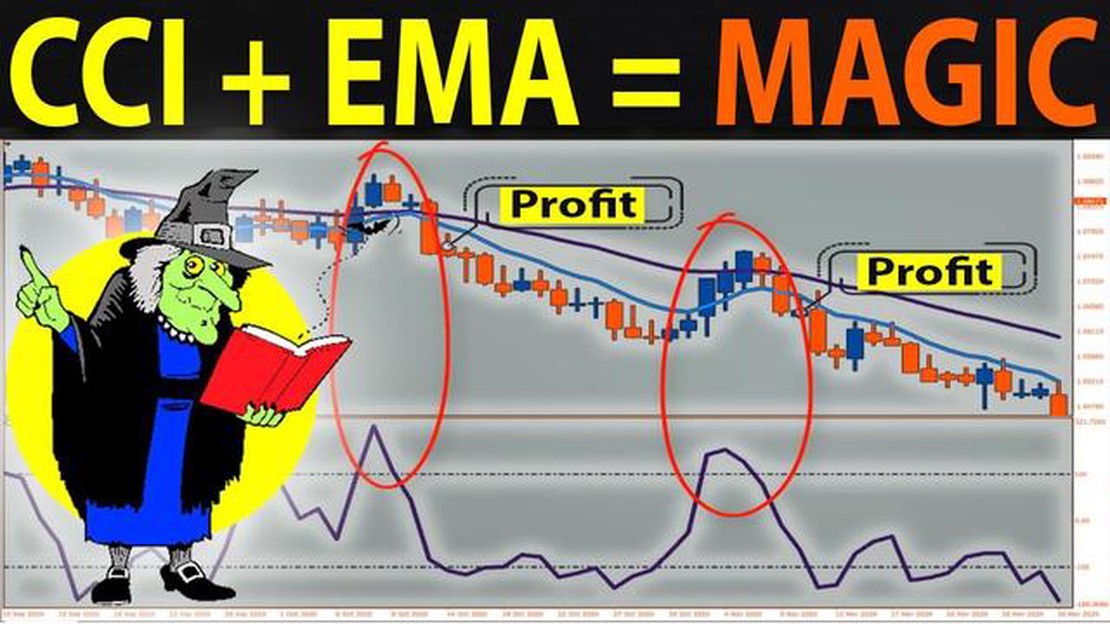
When it comes to trading in the financial markets, having a solid understanding of technical analysis tools is crucial. Two popular indicators that traders often use are the moving average (MA) and the Commodity Channel Index (CCI). These indicators can help traders identify trends, potential reversals, and overbought or oversold conditions in the market.
A moving average is a widely used trend-following indicator that smooths out price data over a specified period of time. It helps traders identify the overall direction of a security’s price movement by filtering out short-term fluctuations. Different types of moving averages, such as the simple moving average (SMA) and the exponential moving average (EMA), can be used depending on the trader’s preference.
The Commodity Channel Index (CCI) is a versatile indicator that measures the current price level relative to an average price level over a specified period of time. It is often used to identify overbought and oversold conditions in the market. Traders generally look for CCI values above +100 to indicate overbought conditions, and values below -100 to indicate oversold conditions. A CCI value of zero is considered to be in the middle range, indicating a neutral market.
By combining the moving average and CCI indicators, traders can gain valuable insights into market trends and potential trading opportunities. For example, when the price of an asset crosses above its moving average, and the CCI indicates an overbought condition, it may be a sign that the market is due for a downward reversal. Conversely, when the price crosses below the moving average and the CCI indicates an oversold condition, it may suggest that the market is ripe for an upward reversal.
It is important to note that no single indicator can guarantee profitable trades. Traders should always analyze multiple indicators, consider other factors such as market conditions and news events, and practice proper risk management techniques when making trading decisions.
As a beginner, it is crucial to gain a solid understanding of these technical analysis tools and to practice using them in combination with other indicators. By doing so, you can enhance your trading skills and improve your ability to make informed trading decisions in the financial markets.
A moving average is a commonly used technical analysis tool that helps traders identify trends and potential reversal points in financial markets. It is calculated by taking the average price of an asset over a specific period of time. The moving average is “moving” because it continually recalculates as new data points are added and older data points are dropped.
The moving average smooths out the price data and provides a clearer picture of the overall trend. It helps filter out noise and short-term fluctuations, allowing traders to focus on the broader market direction.
Traders often use different types of moving averages, such as the simple moving average (SMA) and the exponential moving average (EMA). The SMA gives equal weight to each data point, while the EMA assigns more weight to recent prices, making it more responsive to sudden price changes.

The moving average can also act as dynamic support or resistance levels. When the price is above the moving average, it indicates an uptrend, and the moving average may act as a support level. Conversely, when the price is below the moving average, it indicates a downtrend, and the moving average may act as a resistance level.
Traders often use the moving average in conjunction with other technical indicators, such as the Commodity Channel Index (CCI), to confirm trading signals and increase the probability of successful trades.
Read Also: George Soros Forex Strategy Uncovered: Learn the Secrets Behind His Success
In conclusion, the moving average is a versatile tool that helps traders identify trends, filter out noise, and determine potential support and resistance levels. It is an essential component of technical analysis and can be used in various trading strategies.
Using the moving average indicator in trading can help traders identify trends, determine entry and exit points, and make informed trading decisions. Here are some key ways to use the moving average:
1. Trend Identification: The moving average can help identify the direction of the market trend. Traders can use a longer-term moving average, such as a 50-day or 200-day moving average, to determine if the trend is bullish or bearish.
2. Entry and Exit Signals: Moving averages can provide signals for entering or exiting trades. For example, when the price crosses above the moving average, it may signal a buying opportunity. Conversely, when the price crosses below the moving average, it may indicate a selling opportunity.
3. Support and Resistance Levels: Moving averages can act as support or resistance levels. Traders often look for price bounces off the moving average as potential buying or selling opportunities.
4. Moving Average Crossovers: The crossover of two moving averages can indicate a change in the market trend. For example, a bullish crossover occurs when a shorter-term moving average crosses above a longer-term moving average, suggesting a potential uptrend.
Read Also: The Disadvantages of TD Ameritrade: What You Need to Know
5. Confirmation Tool: The moving average can be used as a confirmation tool along with other technical indicators. Traders may wait for a moving average signal to align with other indicators, such as the Relative Strength Index (RSI), before making a trading decision.
It’s important to note that the moving average is a lagging indicator, meaning it reacts to price changes after they occur. Traders should consider using other technical indicators and fundamental analysis in conjunction with the moving average to improve their trading strategies.

A moving average is a statistical indicator that helps to smooth out price data by calculating the average price over a specific period of time.
A moving average works by continuously recalculating the average price of an asset over a specific time period. It is often used to identify trends and potential support or resistance levels.
The significance of a moving average crossover is that it can indicate a potential change in trend. When a short-term moving average crosses above a long-term moving average, it is considered a bullish signal, while a cross below is considered bearish.
CCI stands for Commodity Channel Index. It is a technical indicator that measures the current price level relative to its average price level over a given period of time.
CCI can be used in trading to identify overbought or oversold conditions and potential trend reversals. Traders often look for CCI values above +100 for overbought conditions and values below -100 for oversold conditions.
The moving average is a widely used technical indicator in trading. It is calculated by taking the average price of a security over a specified period of time. It helps smooth out price fluctuations and allows traders to identify trends and potential entry and exit points.
The moving average can be used in a variety of ways in trading strategies. One common use is to identify trend reversals. When the price of a security crosses above its moving average, it could be a signal to buy, and when it crosses below the moving average, it could be a signal to sell. Traders can also use multiple moving averages with different time periods to confirm trends and generate buy or sell signals.

What is commission in mt4? For traders in the foreign exchange market, MetaTrader 4 (MT4) is a widely used trading platform. It offers a variety of …
Read Article
Is Swing Trading with Options Profitable? Swing trading with options is a popular strategy among traders and investors looking to maximize their …
Read Article
Mastercard Stock Options: What You Need to Know Stock options are a common way for companies to incentivize their employees and align their interests …
Read Article
Understanding BNM FEA Rules: Everything You Need to Know Foreign Exchange Administration (FEA) rules established by the Central Bank of Malaysia, also …
Read Article
Is Absa Bank in Europe? When it comes to global banking, Absa Bank is a prominent name that often comes up. With a strong presence in Africa, many may …
Read Article
Understanding ASC 718: Stock-Based Compensation Expenses Welcome to our comprehensive guide on ASC 718 10 25 15! Whether you’re an accounting …
Read Article


