


The Top Brokers Preferred by Professional Forex Traders
Best Brokers for Professional Forex Traders When it comes to forex trading, having a reliable and experienced broker by your side is crucial. …
Read Article
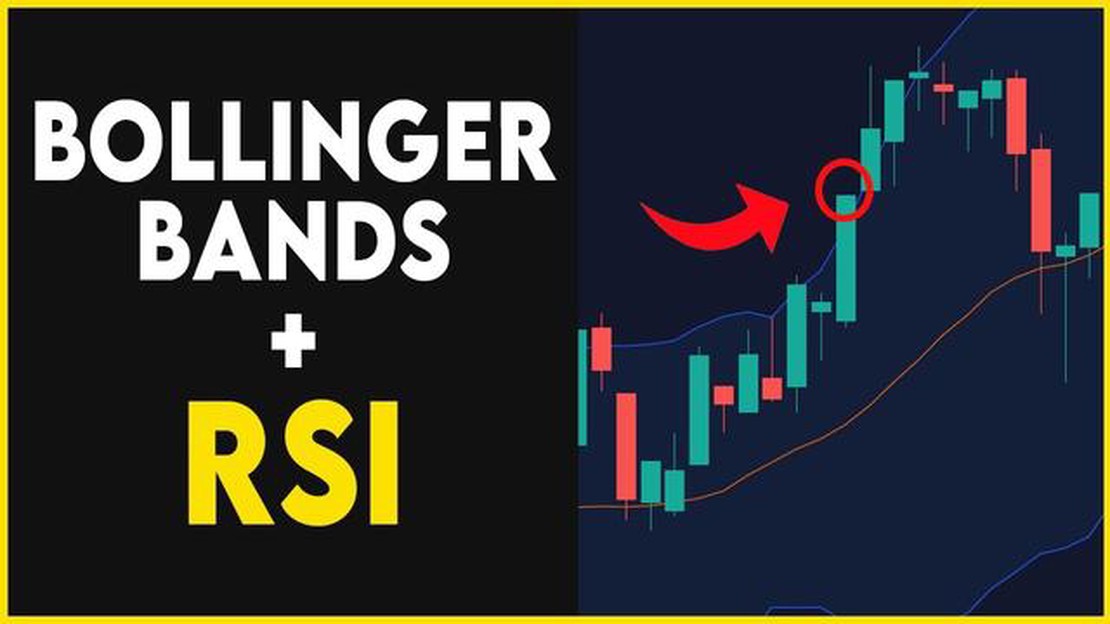
Bollinger Bands are a popular technical analysis tool used by traders to assess market volatility and potential price reversals. Created by John Bollinger in the 1980s, this indicator consists of three lines placed on a price chart. The middle line represents the moving average, while the upper and lower lines form a dynamic channel based on the standard deviation of price movements.
The main purpose of Bollinger Bands is to identify periods of high and low volatility in the market. When the price is trading near the upper band, it indicates that the market is overbought and a reversal might occur. Similarly, when the price is trading near the lower band, it suggests that the market is oversold and a potential reversal to the upside is possible.
Traders can use Bollinger Bands in various ways to develop effective trading strategies. One common approach is to combine them with other technical indicators, such as the Relative Strength Index (RSI) or the Moving Average Convergence Divergence (MACD). By using multiple indicators together, traders can increase the accuracy of their signals and make more informed trading decisions.
Another effective way to use Bollinger Bands is to look for price breakouts. When the price breaks above the upper band, it indicates a potential uptrend, while a break below the lower band suggests a potential downtrend. Traders can use these breakouts as entry points for their trades, setting stop-loss orders just outside the bands to manage risk.
In conclusion, Bollinger Bands are a versatile tool that can be used in various trading strategies. Whether you are a day trader or a long-term investor, incorporating Bollinger Bands into your analysis can help you identify potential entry and exit points with greater accuracy. Remember to always combine them with other indicators and to practice proper risk management to maximize the effectiveness of this tool.

Bollinger Bands are a technical analysis tool developed by John Bollinger in the 1980s. They are plotted two standard deviations away from a simple moving average, creating an envelope around the price action. The standard deviation used in the calculation is typically 20 periods.
The upper band is calculated by adding two standard deviations to the moving average, while the lower band is calculated by subtracting two standard deviations from the moving average. This creates bands that dynamically adjust to market conditions, widening during periods of high volatility and narrowing during periods of low volatility.
Read Also: Knowing When to Buy and When to Sell in Trading: A Guide for Traders
Bollinger Bands are often used to identify overbought and oversold conditions, as well as to determine the strength and direction of a trend. When the price moves close to the upper band, it is considered overbought, while a move close to the lower band is considered oversold. Traders can look for reversal signals when the price touches or crosses the bands.
Bollinger Bands are highly effective for trading due to their ability to provide valuable information about market volatility and potential price reversals. Developed by John Bollinger in the 1980s, this technical analysis tool consists of a simple moving average line and two bands that are plotted above and below the moving average.
There are several reasons why Bollinger Bands are considered effective for trading:
| 1. Volatility indication: | Bollinger Bands expand and contract based on market volatility. When the bands widen, it indicates higher volatility, and when they tighten, it indicates lower volatility. Traders can use this information to identify potential trading opportunities. |
| 2. Support and resistance levels: | The upper and lower bands of the Bollinger Bands act as dynamic support and resistance levels. When the price reaches the upper band, it can be considered overbought, and when it reaches the lower band, it can be considered oversold. Traders can look for potential reversals or price bounces near these bands. |
| 3. Trend identification: | If the price is consistently trending above the moving average and the bands are widening, it indicates an uptrend. Conversely, if the price is consistently trending below the moving average and the bands are widening, it indicates a downtrend. Traders can use these signals to confirm the strength and direction of a trend. |
| 4. Entry and exit signals: | Bollinger Bands can generate entry and exit signals. For example, when the price touches the upper band, it may be a signal to sell or take profits. Conversely, when the price touches the lower band, it may be a signal to buy or enter a long position. Traders can combine Bollinger Bands with other technical indicators to enhance their trading strategies. |
In conclusion, Bollinger Bands are effective for trading because they provide valuable insights into market volatility, support and resistance levels, trend identification, and entry and exit signals. Traders who understand and utilize Bollinger Bands as part of their trading strategies can improve their decision-making and increase their chances of successful trades.
Bollinger Bands are a popular technical analysis tool used by traders to identify market trends and price volatility. They consist of three lines: the middle band, which is a simple moving average (SMA), and two outer bands that are based on standard deviations of the middle band. These bands expand and contract based on market volatility.
Traders can use Bollinger Bands in various trading strategies to make informed buying and selling decisions. Here are a few commonly used strategies:
These are just a few examples of how traders can use Bollinger Bands for trading strategies. It’s important to note that no single strategy guarantees success, and traders should use other technical indicators and analysis techniques to confirm signals from Bollinger Bands.
Read Also: Discover the fixed exchange rate between the euro and CFA currency!
By understanding the different strategies and practicing them on historical data or a demo account, traders can gain confidence in using Bollinger Bands effectively for their trading decisions.
Bollinger Bands are a technical analysis tool that consists of a moving average line in the center and two outer bands, which are standard deviations above and below the moving average. They are used to measure volatility and identify potential overbought or oversold conditions in the market.

Bollinger Bands can be used in various ways for trading strategies. Some common strategies include using the bands to identify overbought or oversold conditions and look for potential reversals, using the bands to identify volatility contractions and expansions for breakout trades, and using the bands as dynamic support and resistance levels for trend trading.
When using Bollinger Bands, it is important to consider the duration of the moving average and the standard deviation settings. Shorter moving averages and smaller standard deviations provide more sensitive signals but may generate more false signals. Longer moving averages and larger standard deviations provide smoother signals but may result in delayed signals. It is also important to consider other technical indicators and analysis tools in conjunction with Bollinger Bands for confirmation and validation of signals.
Yes, Bollinger Bands can be used for all types of securities, including stocks, currencies, commodities, and indices. However, it is important to adjust the settings of the bands to suit the specific characteristics of each security. For example, more volatile securities may require larger standard deviations to capture price movements effectively.

Best Brokers for Professional Forex Traders When it comes to forex trading, having a reliable and experienced broker by your side is crucial. …
Read Article
How Forex Payments Work: A Comprehensive Guide Forex, or foreign exchange, is the largest and most liquid market in the world. With trillions of …
Read Article
Understanding Covariance Matrix Values Covariance matrix is a fundamental tool in statistics and data analysis. It provides valuable information about …
Read Article
Understanding the Significance of Weekly Options Trading Weekly options trading can be an exciting and potentially profitable venture for investors …
Read Article
Understanding the Mechanics of an Arma Model Arma is a widely popular video game that has garnered a dedicated fan base over the years. One of the …
Read Article
When is the best time to exercise or sell stock options? If you are a stock option holder, knowing when to exercise your options can make a …
Read Article


