


Best Software for Trading: Find the Right Choice for You
Choosing the Best Software for Trading Trading in today’s fast-paced financial markets requires sophisticated and reliable software. With so many …
Read Article
The Awesome Oscillator is a technical analysis tool used by traders to identify potential trends in the financial markets. Developed by Bill Williams, a renowned trader and author, this indicator is designed to provide insights into the momentum and direction of price movements. Understanding the mechanics of the Awesome Oscillator is crucial for any trader looking to make informed decisions and maximize their profitability.
At its core, the Awesome Oscillator is based on the concept of momentum. It compares the midpoints of the latest 5 and 34 bars to the driving force behind the market in order to provide a visual representation of the market’s momentum. The indicator consists of a histogram that oscillates above and below the zero line, with positive values indicating bullish momentum and negative values indicating bearish momentum.
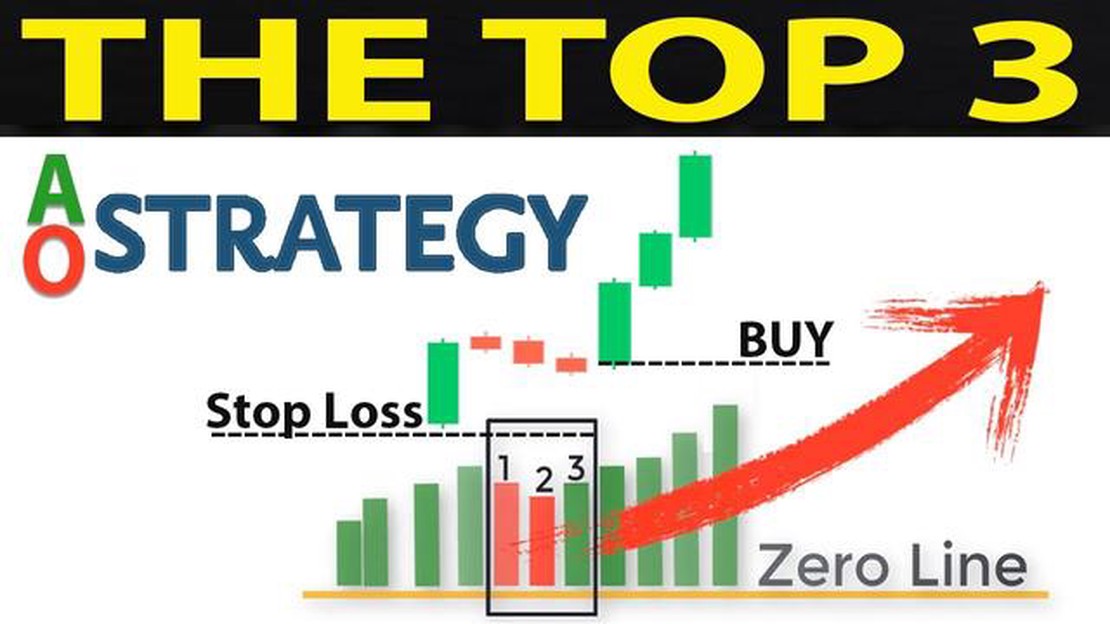
Traders use the Awesome Oscillator to identify key trading signals. A bullish signal occurs when the histogram is above the zero line and the latest bar’s midpoint is higher than the previous bar’s midpoint. Conversely, a bearish signal occurs when the histogram is below the zero line and the latest bar’s midpoint is lower than the previous bar’s midpoint. These signals can help traders identify potential entry and exit points, as well as determine the strength of a trend.
It is important to note that the Awesome Oscillator should be used in conjunction with other technical analysis tools and indicators to improve its accuracy. Traders should also take into consideration market conditions, news events, and other factors that may impact price movements.
In conclusion, the Awesome Oscillator is a powerful tool that can help traders analyze the momentum and direction of price movements. By understanding its mechanics and how to interpret its signals, traders can gain a competitive edge in the financial markets. However, it is important to use this indicator in combination with other tools and to consider other factors that may impact market dynamics. With practice and experience, the Awesome Oscillator can become an invaluable asset in a trader’s toolbox.
Oscillators are a popular tool used in technical analysis to measure the momentum of a financial instrument. They help traders identify overbought and oversold conditions, as well as potential trend reversals. Oscillators are typically displayed as a separate chart below the main price chart.

One of the key features of oscillators is that they fluctuate within a specific range. The range varies depending on the oscillator and can be customized to suit the trader’s needs. Oscillators are usually plotted as a line or a histogram.
There are numerous oscillators available, but they all serve the same purpose: to provide trading signals based on price and volume data. Popular oscillators include the Relative Strength Index (RSI), the Moving Average Convergence Divergence (MACD), and the Stochastic Oscillator.
The RSI measures the speed and change of price movements. It ranges from 0 to 100, with values above 70 indicating an overbought condition and values below 30 indicating an oversold condition. The MACD measures the convergence and divergence of moving averages. It consists of two lines - the MACD line and the signal line. Crossovers between these lines generate trading signals. The Stochastic Oscillator measures the closing price relative to the high-low range over a specified period of time. Readings above 80 indicate overbought conditions and readings below 20 indicate oversold conditions.
Oscillators are used in conjunction with other technical indicators and chart patterns to confirm signals. For example, if an oscillator generates a buy signal, a trader may look for bullish chart patterns or positive divergences with other indicators to confirm the signal.
It is important to note that oscillators should not be used in isolation and should be interpreted in the context of the overall market trend. They are prone to generating false signals in ranging markets and can give conflicting signals in trending markets. Traders should also be aware of periods of low volatility, as oscillators may produce erratic signals during these times.
In conclusion, oscillators are an invaluable tool for traders in technical analysis. They provide insight into the momentum of a financial instrument and help identify potential buying or selling opportunities. However, they should be used in conjunction with other indicators and interpreted in the context of the overall market trend.
Read Also: How to Use Option Chain to Predict Market Trends
The Awesome Oscillator is a technical analysis indicator that is used to measure market momentum. It takes the difference between the 34-period simple moving average and the 5-period simple moving average, and plots it as a histogram. The basic idea behind the Awesome Oscillator is that it helps traders to identify whether bullish or bearish momentum is prevailing in the market.
To calculate the Awesome Oscillator, you first need to calculate the simple moving average (SMA) for two different time periods: 34 periods and 5 periods. The SMA is calculated by adding up the closing prices over the specified time period and dividing it by the number of periods. The 34-period SMA represents long-term momentum, while the 5-period SMA represents short-term momentum.
Read Also: Understanding the Significance of FX Costs: Everything You Need to Know
Next, you subtract the 5-period SMA from the 34-period SMA to get the difference. This difference is then plotted as a histogram, with positive values in green and negative values in red. The histogram helps traders to visually see the difference between the two moving averages and gauge the strength of the market momentum.
When the Awesome Oscillator is above the zero line and the histogram bars are green, it indicates that bullish momentum is prevailing in the market. Conversely, when the Awesome Oscillator is below the zero line and the histogram bars are red, it indicates that bearish momentum is prevailing in the market. Traders can use this information to make better-informed trading decisions.
The Awesome Oscillator is also often used in conjunction with other technical indicators and chart patterns to confirm trading signals. For example, if the price is trending higher and the Awesome Oscillator is showing bullish momentum, it can provide additional confirmation that the uptrend is strong.
In conclusion, the Awesome Oscillator is a powerful tool that helps traders to understand and analyze market momentum. By using the difference between two moving averages, it provides valuable insights into whether bullish or bearish momentum is prevailing. Traders can use this information to make more accurate predictions and improve their trading strategies.
The Awesome Oscillator is a technical analysis indicator that helps to identify the strength of a trend.
The Awesome Oscillator is calculated by taking the difference between the 34-period and the 5-period simple moving averages of the price.

A positive value of the Awesome Oscillator indicates that the momentum is bullish and the trend is likely to continue.
Yes, the Awesome Oscillator can be used to generate trading signals based on divergences and crossovers of the zero line.
Yes, the Awesome Oscillator works best in trending markets and may generate false signals in ranging or choppy markets.
The Awesome Oscillator is a technical indicator that measures the momentum of the market. It is designed to help traders identify potential buying and selling opportunities.

Choosing the Best Software for Trading Trading in today’s fast-paced financial markets requires sophisticated and reliable software. With so many …
Read Article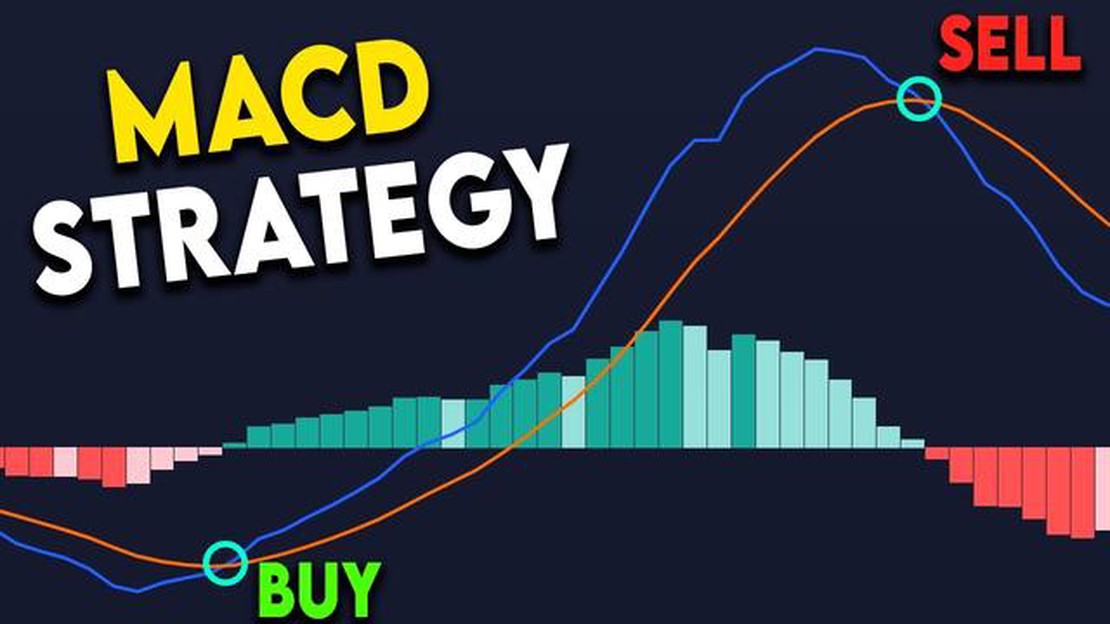
Combining MACD and Moving Average - An Effective Trading Strategy The Moving Average Convergence Divergence (MACD) and moving average are two popular …
Read Article
Reasons behind China’s transition to a managed float system in 2005 China’s decision to shift to a managed float system in 2005 was a significant move …
Read Article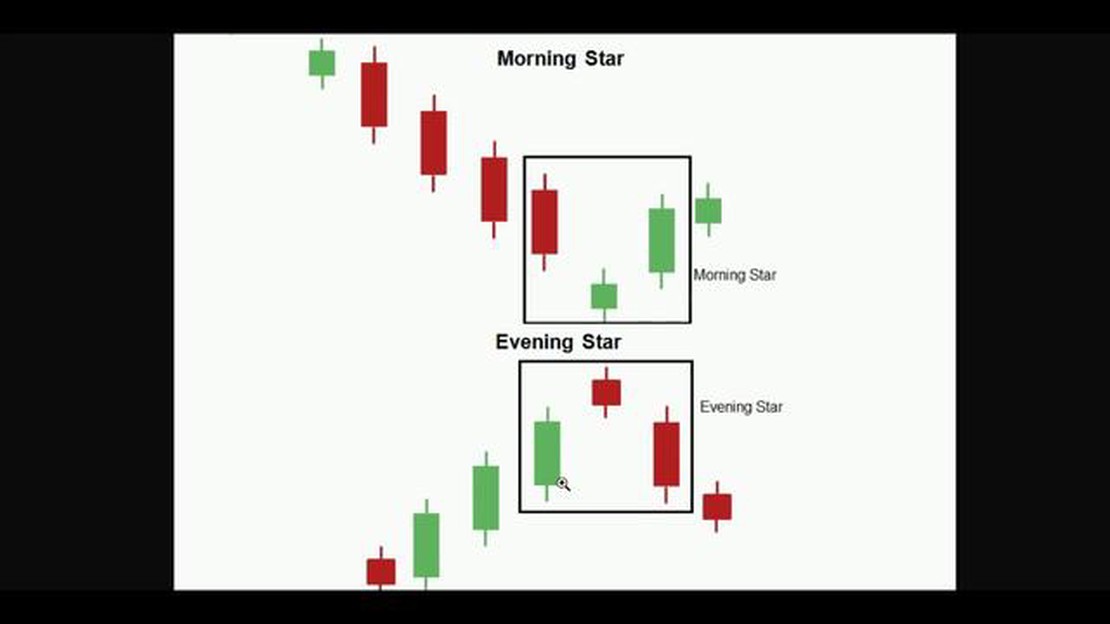
Understanding Morning Star and Evening Star Forex Patterns Forex candlestick patterns are a popular tool used by traders to forecast market movements. …
Read Article
Formula for low-pass filter in Matlab Have you ever wondered how to implement a low-pass filter in Matlab? Well, you’re in luck! In this step-by-step …
Read Article
What Does a Commodity Trading Advisor Do? Commodity trading is a complex and risky business that requires expertise and strategy. For individuals and …
Read Article


