


Step-by-step guide on how to start selling options
Get started selling options in 5 easy steps Options trading can be a lucrative and exciting investment strategy. By selling options, you have the …
Read Article
A pullback is a temporary reversal in the price of a financial instrument, such as a stock, commodity, or currency pair, before it continues its primary trend. Traders often look for pullbacks as potential buying opportunities in an uptrend or selling opportunities in a downtrend.
However, identifying a pullback and confirming its validity is crucial for successful trading. Traders need to use various strategies and indicators to determine if the price movement is indeed a pullback or a potential trend reversal.
One popular strategy to confirm a pullback is to use trend lines. Traders draw trend lines connecting the higher lows in an uptrend or lower highs in a downtrend. If the price retraces back to the trend line and then bounces off it, it could indicate a valid pullback.
In addition to trend lines, traders can also use technical indicators, such as the moving average convergence divergence (MACD) or the relative strength index (RSI), to confirm a pullback. These indicators can help identify overbought or oversold conditions, indicating a potential pullback in the price.
It’s important to remember that confirming a pullback is not foolproof, and traders should always use proper risk management techniques and consider other factors, such as market conditions and news events, before making trading decisions.
By using a combination of technical analysis tools, such as trend lines and indicators, traders can increase their chances of successfully identifying and confirming a pullback. This can help them make informed trading decisions and potentially profit from temporary price reversals in the market.
In trading, a pullback refers to a temporary reversal in the direction of a trend. It is a short-term counter-movement against the prevailing trend, typically retracing a portion of the prior price move. Pullbacks are a natural part of market dynamics and can offer trading opportunities for skilled investors.

Traders often look for pullbacks as potential entry points to enter a trade in the direction of the overall trend. This strategy is based on the belief that a pullback is a sign of a healthy market, and the trend is likely to continue once the pullback ends.
There are several factors to consider when assessing a pullback in trading. First, traders need to identify the primary trend by analyzing price charts and technical indicators. Once the trend is established, they can start looking for pullbacks to confirm their analysis.
Common indicators used to confirm pullbacks include moving averages, trendlines, and oscillators. Moving averages can help identify the overall trend and highlight potential pullback levels. Trendlines are drawn to connect significant swing highs or swing lows and can act as support or resistance during a pullback. Oscillators, such as the relative strength index (RSI) or stochastic oscillator, can indicate overbought or oversold conditions, suggesting a potential pullback.
During a pullback, traders should also pay attention to key support and resistance levels. These levels are often areas where market participants are likely to buy or sell, causing the price to bounce back in the direction of the trend. Breakouts above or below these levels can signal the end of a pullback and the continuation of the trend.
It is important to note that not all pullbacks result in a continuation of the trend. Some pullbacks can lead to trend reversals or range-bound markets. Therefore, traders should always use risk management techniques, such as setting stop-loss orders, to protect their positions in case the pullback turns into a trend reversal.
Read Also: Is the Forex Market a Genuine Investment Opportunity or Scam? Unveiling the Truth
In conclusion, understanding pullbacks in trading is crucial for identifying potential entry points and confirming the continuation of a trend. Traders can use various indicators and tools to assess pullbacks and make informed trading decisions. However, it is essential to practice proper risk management and remain flexible in case the pullback results in a trend reversal.
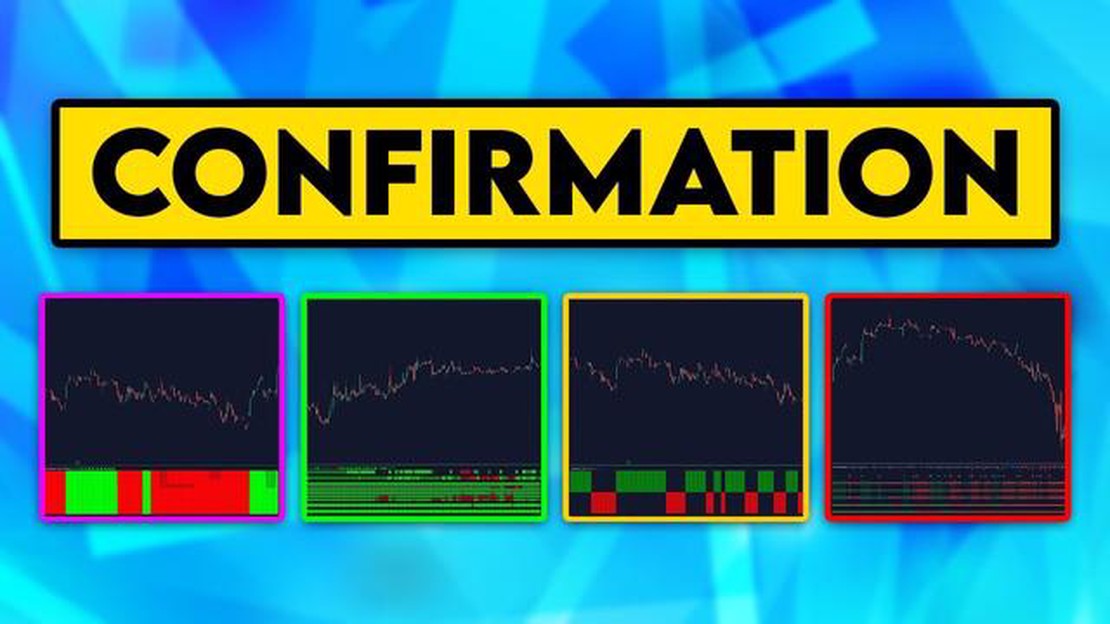
When trading, it’s important to be able to confirm a pullback before taking any action. Here are some strategies and indicators that can help you confirm a pullback:
1. Fibonacci retracement: Fibonacci retracement is a popular tool among traders to identify potential pullback levels. It is based on the theory that retracements tend to occur at specific Fibonacci levels (e.g., 38.2%, 50%, 61.8%). By applying Fibonacci levels to a chart, you can identify potential pullback levels that may act as support or resistance.
2. Moving averages: Moving averages are widely used indicators that can help confirm a pullback. By looking at the interaction between price and moving averages, you can identify when a pullback is likely to occur. For example, a price that pulls back to a rising moving average could be a sign of a healthy pullback in an uptrend.
Read Also: How to manually calculate exponential: step-by-step guide
3. Trendlines: Trendlines can also be used to confirm a pullback. By drawing trendlines on a chart, you can identify the overall trend and potential pullback levels. When price pulls back to a trendline and respects it, it can be a sign of a valid pullback.
4. Oscillators: Oscillators such as the Relative Strength Index (RSI) or the Stochastic Oscillator can help confirm a pullback by identifying overbought or oversold conditions. When an oscillator reaches extreme levels and starts to turn back, it could be a sign that a pullback is likely to occur.
5. Volume analysis: Volume can also be used to confirm a pullback. When the price pullbacks on low volume, it may suggest that the pullback is weak and the trend might continue. On the other hand, a pullback on high volume could indicate a stronger reversal.
6. Candlestick patterns: Candlestick patterns can provide valuable insights into the market sentiment during a pullback. For example, a bullish reversal candlestick pattern like a hammer or engulfing pattern near a potential pullback level could confirm the end of a pullback and the resumption of the trend.
Remember, no single indicator or strategy can guarantee the confirmation of a pullback. It’s important to use a combination of different indicators and strategies to increase the likelihood of confirming a pullback accurately.

A pullback in trading refers to a temporary reversal or retracement in the price of an asset within a broader trend. It is a short-term decline in price that provides an opportunity for traders to enter or add to a position at a more favorable price.
There are several ways to confirm a pullback in trading. One common method is to use trendlines or moving averages. If the price retraces to a trendline or moving average and then bounces off it, it can be considered a confirmation of a pullback. Additionally, traders can look for specific chart patterns or use technical indicators such as the RSI or MACD to confirm a pullback.
There are several strategies to trade pullbacks. One popular strategy is to wait for a pullback to a key support or resistance level and then enter a trade in the direction of the overall trend. Another strategy is to use a moving average crossover, where a shorter-term moving average crosses above or below a longer-term moving average to signal a pullback. Traders can also use breakouts or bounces off trendlines or chart patterns to trade pullbacks.
There are several indicators commonly used to confirm pullbacks in trading. Some of the popular ones include the Relative Strength Index (RSI), Moving Average Convergence Divergence (MACD), Stochastic Oscillator, and Bollinger Bands. These indicators can help traders identify overbought or oversold conditions and confirm the strength or weakness of a pullback.
Confirming a pullback before entering a trade is not necessary, but it can increase the probability of success. By confirming a pullback, traders can ensure that they are trading in the direction of the overall trend and increase their chances of buying at a favorable price. However, some traders may prefer to enter trades without confirmation, relying on other factors such as momentum or market sentiment.
A pullback in trading refers to a temporary reversal or retracement in the price of an asset within an overall trend. It occurs when the price temporarily moves against the trend before resuming its original direction.

Get started selling options in 5 easy steps Options trading can be a lucrative and exciting investment strategy. By selling options, you have the …
Read Article
Today’s Price of 1 Tola Gold in Pakistan In Pakistan, gold is not just a precious metal, but also a symbol of wealth and prosperity. The allure of …
Read Article
What is the significance of the DXY index? The DXY index, also known as the U.S. Dollar Index, is a widely recognized measure of the value of the …
Read Article
How to stack two images in ImageJ? ImageJ is a powerful image processing software that provides various tools and functions for scientific and …
Read Article
Understanding the Bulls Moving Average Algorithm The Bulls Moving Average Algorithm is a popular tool used in technical analysis to predict future …
Read Article
Can foreigners trade on the JSE? The Johannesburg Stock Exchange (JSE) is the largest stock exchange on the African continent, providing a platform …
Read Article


