


2023 Flat Tax Rate for Foreigners in Korea: Everything You Need to Know
Flat Tax Rate for Foreigners in Korea 2023 South Korea has recently implemented a new tax policy that aims to attract foreign talent and boost the …
Read Article
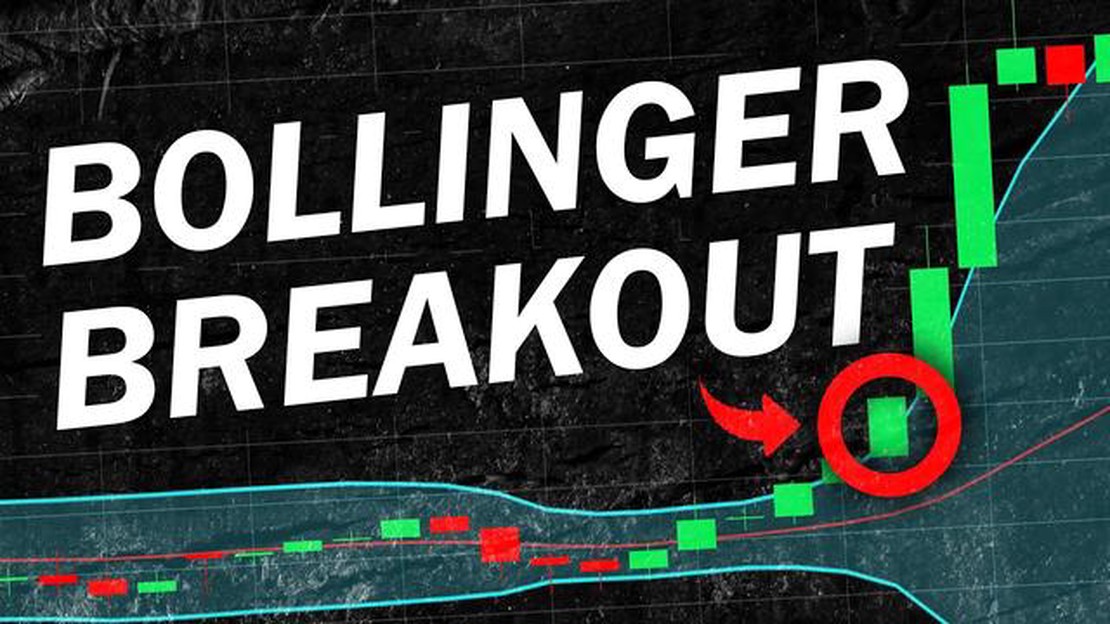
Bollinger Bands is a popular technical analysis tool that is widely used by traders in the financial markets. Developed by John Bollinger in the 1980s, Bollinger Bands are a set of three lines plotted on a price chart. The middle band is a simple moving average, while the upper and lower bands are standard deviations of the price.
Bollinger Bands are primarily used to identify periods of low volatility and high volatility in the markets. When the Bollinger Bands contract, it indicates that the market is in a period of low volatility, also known as a squeeze. Conversely, when the Bollinger Bands expand, it suggests that the market is in a period of high volatility.
During a Bollinger Bands squeeze, the price often consolidates within a narrow range. Traders interpret this as a sign of an impending breakout, where the price is expected to break out of the squeeze and move in either an upward or downward direction. This presents an opportunity for traders to profit from the subsequent price movement.
Traders can use various techniques in conjunction with Bollinger Bands to identify breakout opportunities. One commonly used method is to wait for the price to break above the upper band or below the lower band, indicating a potential bullish or bearish breakout, respectively. Another technique is to wait for the Bollinger Bands to contract to their narrowest point and then trade in the direction of the breakout.
Bollinger Bands are a popular technical analysis tool that helps traders identify potential breakout opportunities in the market. The Bollinger Bands consist of a middle band, which is a simple moving average, and two outer bands that are standard deviations away from the middle band.
One important concept associated with Bollinger Bands is the “squeeze”. A squeeze occurs when the distance between the upper and lower bands narrows, indicating a period of low volatility in the market. During a squeeze, the Bollinger Bands appear to compress or “squeeze” together, hence the name.
A squeeze is often followed by a breakout, where the price breaks out of the narrow range and starts trending in a new direction. Traders use the Bollinger Bands squeeze as a signal to alert them to potential breakout opportunities.
When the Bollinger Bands squeeze, it suggests that a period of low volatility is about to end, and a period of high volatility and price movement is imminent. This is because periods of low volatility are often followed by periods of high volatility.

Traders look for several signs to confirm a Bollinger Bands squeeze and potential breakout. One sign is a significant decrease in the width of the bands, indicating a narrow trading range. Another sign is the contraction of the bands towards the middle band, showing the compression of prices. Additionally, traders may look for signs of consolidation in the price action and decreasing volume levels.
Once a Bollinger Bands squeeze is identified, traders typically wait for a breakout confirmation before entering a trade. A breakout confirmation occurs when the price breaks above the upper band in an uptrend or below the lower band in a downtrend. This breakout confirmation suggests that the period of low volatility has ended, and a new trend is beginning.
It is important to note that while Bollinger Bands squeeze can signal potential breakout opportunities, they are not a guarantee of future price movement. Traders should always use additional technical analysis tools and consider other factors before making trading decisions.
Read Also: Understanding FX and IR: A Comprehensive Guide for Traders and Investors
In conclusion, understanding the mechanics of Bollinger Bands squeeze is crucial for traders looking to identify potential breakout opportunities. By recognizing the signs of a squeeze and waiting for a breakout confirmation, traders can take advantage of periods of increased volatility and potentially profit from the market’s directional movements.
Bollinger Bands are a popular technical analysis tool that can be used to identify potential breakout opportunities in the market. By analyzing the price volatility of a security, Bollinger Bands provide traders with important information about potential trading opportunities.
The concept behind Bollinger Bands is based on the idea that price tends to move between upper and lower bands. These bands are created by calculating a simple moving average (SMA) and adding or subtracting a certain number of standard deviations.
When the price is trading within the bands, it suggests that the market is in a range-bound state. However, when the price starts to squeeze towards the bands, it indicates a decrease in volatility and a potential upcoming breakout.
The squeeze in Bollinger Bands occurs when the distance between the upper and lower bands narrows significantly. This tightening of the bands signals that there is a compression in price action and a potential break from the range-bound state.
Traders can watch for the squeeze and use it as an indication to prepare for a breakout. When the price breaks above the upper band, it suggests a potential bullish breakout, whereas a breakout below the lower band indicates a potential bearish breakout.
Read Also: Is Yahoo Finance Historical Data Accurate? Exploring the Reliability of Yahoo Finance's Historical Market Data
| Step | Action |
|---|---|
| 1 | Identify a security that is in a range-bound state and has started to squeeze towards the Bollinger Bands. |
| 2 | Monitor the price action as it approaches the bands. |
| 3 | Look for a breakout above the upper band or below the lower band. |
| 4 | Confirm the breakout with other technical indicators or chart patterns. |
| 5 | Place a trade in the direction of the breakout. |
It is important to note that Bollinger Bands are not a stand-alone indicator. It is recommended to use them in combination with other technical analysis tools to increase the probability of success.
By identifying potential breakout opportunities with Bollinger Bands, traders can take advantage of market movements and potentially generate profits. However, it is crucial to always practice proper risk management and adhere to a trading plan.

Bollinger Bands are a technical analysis tool that consists of a moving average line and two price channels plotted above and below. The bands expand and contract based on market volatility. When the bands squeeze together, it indicates low volatility, and traders use this information to anticipate an upcoming breakout.
Bollinger Bands can help identify breakout opportunities by showing when the market is in a period of low volatility. When the bands tighten, it suggests that a breakout may be imminent. Traders can look for a break above the upper band or below the lower band to signal a potential bullish or bearish breakout, respectively.
Bollinger Bands can be used in a variety of markets, including stocks, forex, and commodities. However, they are most effective in sideways or ranging markets where price movements are not strongly trending. In strongly trending markets, the bands may remain expanded for extended periods, making them less reliable for indicating breakouts.
Some common strategies for trading Bollinger Band breakouts include the “Squeeze” strategy and the “Bollinger Band Walk” strategy. The Squeeze strategy involves waiting for the bands to narrow and then entering a trade when the price breaks above the upper band or below the lower band. The Bollinger Band Walk strategy involves trading the price as it moves along the outer edges of the bands.
Yes, Bollinger Bands can be used alongside other technical indicators to confirm trading signals. For example, traders may consider using other indicators like the Relative Strength Index (RSI) or the Moving Average Convergence Divergence (MACD) to validate a potential breakout signal indicated by the Bollinger Bands. Combining multiple indicators can increase the reliability of trading signals.
Bollinger Bands are a technical analysis tool that consists of a middle band and two outer bands. The middle band is usually a simple moving average, while the outer bands are typically two standard deviations above and below the middle band.
You can use Bollinger Bands to identify breakout opportunities by looking for periods of low volatility indicated by the narrowing of the bands. When the bands squeeze together, it suggests that a breakout move is likely to occur. Traders often look for a breakout when price moves outside of the bands.

Flat Tax Rate for Foreigners in Korea 2023 South Korea has recently implemented a new tax policy that aims to attract foreign talent and boost the …
Read Article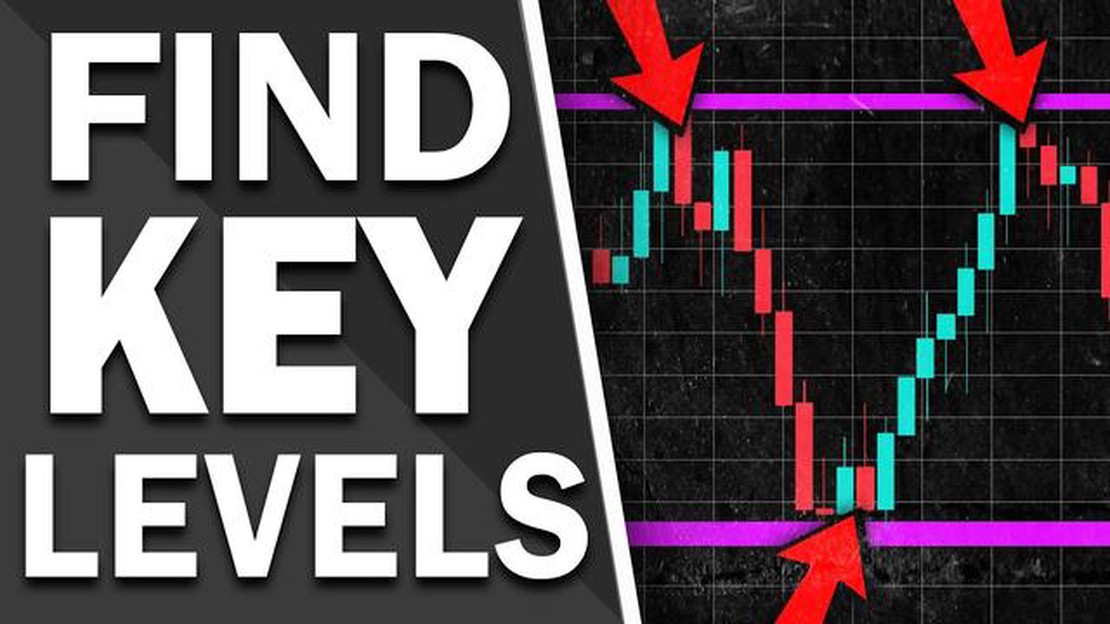
Calculating Support and Resistance in Forex Support and resistance levels are crucial indicators in forex trading. They help traders identify …
Read Article
Is 1% equity in a start up good? When it comes to joining a start-up, one of the most important factors to consider is the equity you will receive. …
Read Article
Is Crypto the Same as Gambling? Both cryptocurrency and gambling involve risk and the potential for financial gain or loss. However, there are …
Read Article
Understanding Long Stock Options If you’re new to the world of investing, the concept of stock options may seem complex and overwhelming. However, …
Read Article
Python: How to Get Forex Data? Foreign exchange market or Forex is the largest and most liquid financial market in the world. Traders and investors …
Read Article


