


Forex Trading Hours in the Philippines: Everything You Need to Know
Forex Trading Hours in the Philippines If you’re interested in forex trading in the Philippines, one of the first things you need to understand is the …
Read Article
Bollinger Bands is a popular technical analysis tool used by traders and investors to identify potential trading opportunities and make informed decisions. Developed by John Bollinger in the early 1980s, Bollinger Bands are widely used in the financial markets, including stocks, forex, and commodities.
Bollinger Bands consist of three lines: the middle band, which is a simple moving average; and the upper and lower bands, which are calculated based on the standard deviation of the middle band. The upper and lower bands dynamically adjust to the volatility of the market, expanding during periods of high volatility and contracting when the market is less volatile.
The theory behind Bollinger Bands is based on the premise that price tends to stay within the upper and lower bands. When the price is near the upper band, it is considered overbought, and when it is near the lower band, it is considered oversold. Traders use these levels to identify potential reversal points and to determine whether an asset is overvalued or undervalued.
Traders also use Bollinger Bands to analyze volatility and assess the strength of a trend. When the bands are narrow, it indicates low volatility, suggesting that a breakout may be imminent. Conversely, when the bands are wide, it suggests high volatility, which could indicate a strong trend.
Understanding the theory of Bollinger Bands is essential for traders and investors who want to make informed decisions and improve their trading strategies. By understanding how Bollinger Bands work and how to interpret them, traders can gain valuable insights into market trends, volatility, and potential reversal points.
The SMA is calculated by summing up the closing prices of a given period and dividing it by the number of periods. This moving average represents the average price over the chosen time frame.
The upper and lower bands are calculated by adding and subtracting a certain multiple of the standard deviation from the SMA. The standard deviation is a measure of volatility and shows how much the price deviates from the average. The most common multiple used is 2, which means that the bands will encompass approximately 95% of the price action.
Bollinger Bands serve multiple purposes. Firstly, they provide a visual representation of market volatility. When the bands are narrower, it indicates low volatility and potential consolidation. Conversely, wider bands suggest higher volatility and the possibility of significant price movements.
Secondly, Bollinger Bands can be used to identify overbought and oversold conditions of an asset. When the price reaches the upper band, it suggests that the asset may be overbought, and a price reversal or correction might occur. Conversely, when the price touches the lower band, it suggests that the asset may be oversold, and a price bounce or reversal may happen.

Additionally, Bollinger Bands can be used as a tool for trend identification. If the price consistently stays above the SMA and the upper band, it suggests an uptrend. Conversely, if the price stays below the SMA and the lower band, it indicates a downtrend.
Traders often use Bollinger Bands in conjunction with other technical indicators to confirm signals and make more informed trading decisions. It is important to note that Bollinger Bands are not foolproof and can produce false signals, especially during periods of low volatility or in sideways markets.
In conclusion, Bollinger Bands offer a comprehensive way to analyze price volatility, identify potential price reversals, and determine market trends. They are a valuable tool used by traders to enhance their technical analysis and make more accurate trading decisions.
1. Identifying overbought and oversold conditions
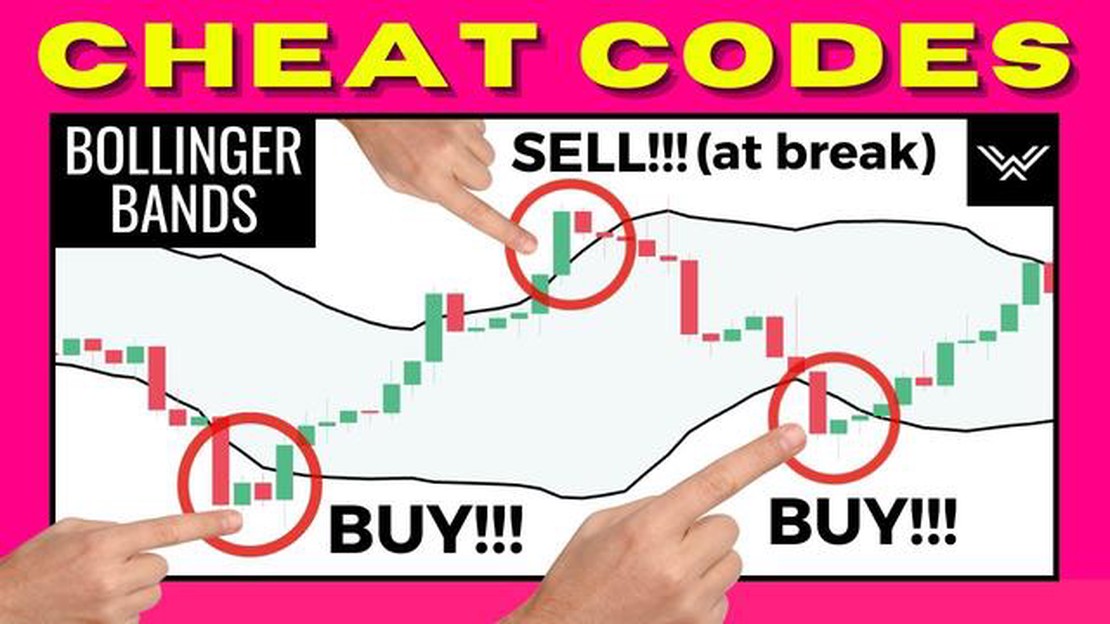
Bollinger Bands are often used to identify overbought and oversold conditions in the market. When prices touch or exceed the upper band, it may indicate that the market is overbought and a reversal or consolidation is likely to occur. Conversely, when prices touch or fall below the lower band, it may suggest that the market is oversold and a potential price increase may occur.
Read Also: Understanding Momentum Trading: Key Indicators to Watch
2. Signal for trend reversals
Bollinger Bands can also be a useful tool for identifying potential trend reversals. When prices move outside the bands, it may signal a potential reversal in the current trend. Traders often look for confirmation from other technical indicators or patterns before taking a position.
Read Also: Understanding Block Trades in Options: Explained
3. Volatility measurement
Bollinger Bands also act as a measure of volatility. When the bands are narrow, it indicates low volatility, while wider bands suggest higher volatility. Traders can use this information to adjust their trading strategies accordingly.
4. Entry and exit points
Traders often use Bollinger Bands to determine entry and exit points for their trades. For example, when prices break above the upper band, it may signal a buying opportunity, while a break below the lower band may indicate a potential selling opportunity.
5. Stop-loss placement

Bollinger Bands can also be used to determine appropriate stop-loss levels. Traders may place their stop-loss orders below the lower band for long positions and above the upper band for short positions. This helps to protect against potential losses and manage risk.
Overall, Bollinger Bands offer a wide range of practical applications for traders and investors. By understanding how to interpret and use them effectively, traders can gain valuable insights into market conditions and make more informed trading decisions.
Bollinger Bands are a technical analysis tool that helps traders to identify potential price reversals and volatility in the market. They consist of three lines: a middle line (typically a simple moving average), and an upper and lower band that are usually two standard deviations away from the middle line.
Bollinger Bands can be used in various ways in trading. One common strategy is to look for price breakouts from the bands, which can indicate a strong trend and potential trade opportunities. Traders can also use Bollinger Bands to identify overbought and oversold conditions, as well as to track volatility in the market.
There are several advantages of using Bollinger Bands in trading. They provide traders with a visual representation of volatility, which can be helpful in identifying potential trading opportunities. Bollinger Bands are also flexible and can be used in different timeframes and markets. Additionally, they are widely used by traders, which means they may have a self-fulfilling prophecy effect.
Yes, Bollinger Bands can be used by traders of all levels of experience. However, it is important to note that Bollinger Bands are just one tool among many in technical analysis, and should be used in conjunction with other indicators and analysis techniques.
Yes, Bollinger Bands can be used in conjunction with other indicators to enhance trading strategies. For example, some traders use Bollinger Bands in combination with trend lines or oscillators to confirm signals and increase the accuracy of their trades. It is important to experiment and find the combination of indicators that works best for each individual trader.
Bollinger Bands are a technical analysis tool that consists of a middle band, which is a simple moving average, and two outer bands that are standard deviations above and below the middle band. They are used to measure volatility and identify potential price reversals.

Forex Trading Hours in the Philippines If you’re interested in forex trading in the Philippines, one of the first things you need to understand is the …
Read Article
Understanding the Factors that Drive VIX 75 The VIX 75 Index, also known as the Volatility Index, is a measure of market risk and investor sentiment. …
Read Article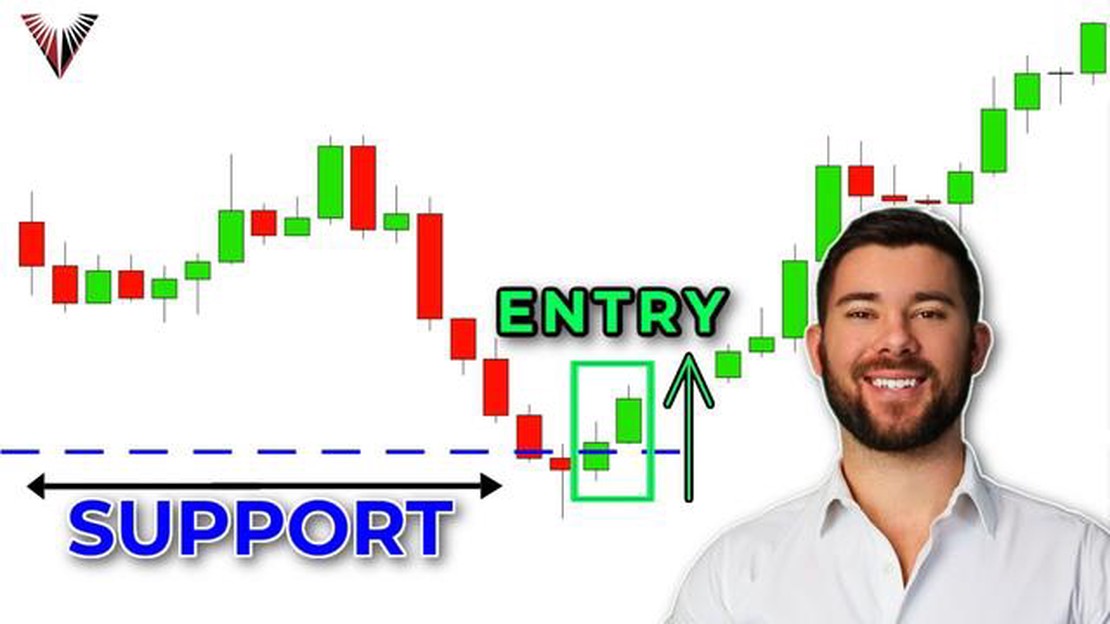
Understanding Support and Resistance Trading Strategy Support and resistance are fundamental concepts in technical analysis that are widely used by …
Read Article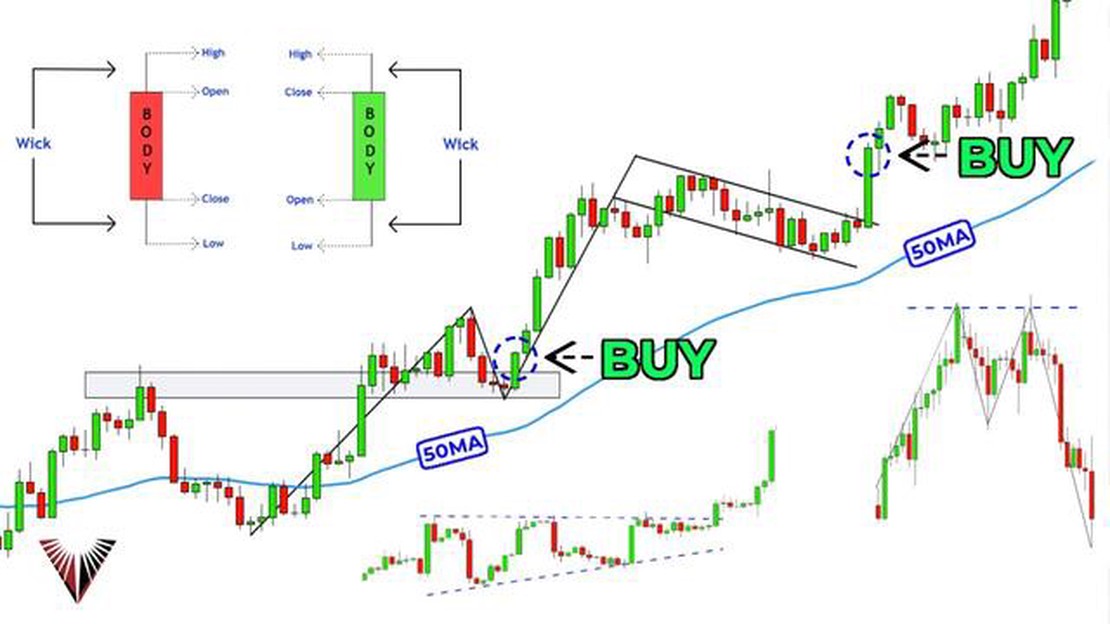
Analyzing the Trading Market: A Comprehensive Guide Trading in the financial markets can be a lucrative endeavor if approached with the right …
Read Article
EU ETS emitters: A Complete Guide The European Union Emissions Trading System (EU ETS) is a key policy tool used by the European Union member states …
Read Article
Blue Dollar Exchange Rate The blue dollar exchange rate refers to the unofficial currency exchange rate used in Argentina, which is different from the …
Read Article


