


Is Forex Leverage Still of Interest in 2021? Exploring the Pros and Cons
Exploring the Interest in Forex Leverage Forex trading has always been an enticing opportunity for investors and traders due to its potential for high …
Read Article
The Moving Average Convergence Divergence (MACD) and moving average are two popular technical indicators used by traders to analyze market trends and make informed trading decisions. When used together, these indicators can provide valuable signals for successful trading.
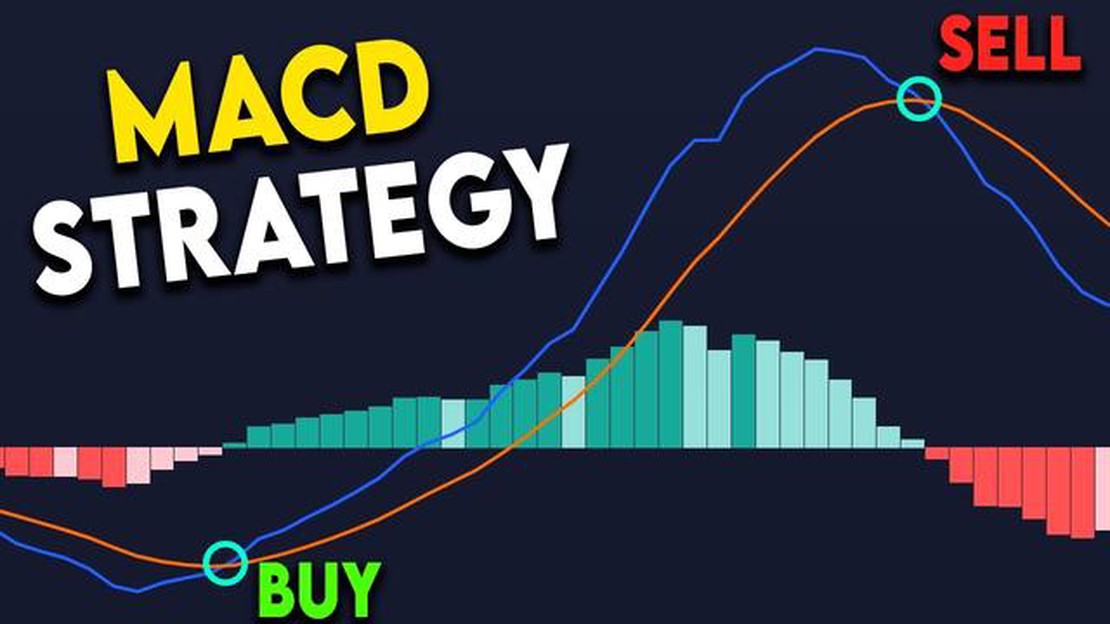
The MACD is a trend-following momentum indicator that measures the relationship between two moving averages of an asset’s price. It consists of two lines - the MACD line and the signal line. When the MACD line crosses above the signal line, it generates a bullish signal, indicating a potential uptrend. On the other hand, when the MACD line crosses below the signal line, it generates a bearish signal, indicating a potential downtrend.
The moving average, on the other hand, is a lagging indicator that smoothes out price data over a specific period of time. It helps traders identify the overall trend of an asset and filter out noise. The most commonly used moving averages are the simple moving average (SMA) and the exponential moving average (EMA).
By combining the MACD and moving average, traders can have a more comprehensive view of the market. One common strategy is to wait for the MACD line to cross above the signal line and for the price to be above the moving average. This can be an indication of a strong bullish trend and a potential buying opportunity. Similarly, when the MACD line crosses below the signal line and the price is below the moving average, it can be a sign of a strong bearish trend and a potential selling opportunity.
It’s important to note that no indicator or combination of indicators can guarantee profitable trades. Traders should always use these indicators in conjunction with other technical and fundamental analysis tools, and consider other factors such as market conditions and risk management strategies. Additionally, it’s recommended to backtest and validate any trading strategy before applying it in live markets.
In conclusion, the combination of the MACD and moving average can be a powerful tool for traders to identify potential trading opportunities. By understanding how these indicators work and using them in conjunction with other analysis techniques, traders can increase their chances of making successful trades.
MACD (Moving Average Convergence Divergence) and Moving Average are two popular technical indicators that can be used for effective trading strategies. These indicators help traders analyze price trends and potential entry and exit points in the market.

MACD is a trend-following momentum indicator that shows the relationship between two moving averages of a security’s price. It consists of two lines - the MACD line and the signal line. The MACD line is calculated by subtracting the 26-day exponential moving average (EMA) from the 12-day EMA, while the signal line is the 9-day EMA of the MACD line. Traders look for crossovers between these lines to identify buy or sell signals.
Moving Average, on the other hand, is a simple calculation of the average price over a specified period of time. It is used to smooth out price fluctuations and identify trends. Traders often use different time periods for moving averages, such as the 50-day, 100-day, or 200-day moving averages, to analyze short-term or long-term trends in the market.
Read Also: Examples of ETD Derivatives: A Comprehensive Overview
Both MACD and Moving Average can be used independently, but they are often used together to confirm trading signals. When the MACD line crosses above the signal line and the price is above the moving average, it can be a bullish signal, indicating a potential buy opportunity. Conversely, when the MACD line crosses below the signal line and the price is below the moving average, it can be a bearish signal, indicating a potential sell opportunity.
By combining MACD and Moving Average, traders can have a more comprehensive view of the market and make more informed trading decisions. These indicators can help traders identify trends, determine entry and exit points, and manage risk. However, it is important to note that no indicator is foolproof and traders should use other tools and techniques, along with MACD and Moving Average, to analyze the market and make trading decisions.
In conclusion, MACD and Moving Average are important tools in a trader’s toolkit. They provide valuable insights into the market and can help traders make more successful trading decisions. It is essential for traders to understand how these indicators work and use them in combination with other tools and techniques to maximize their trading effectiveness.
MACD (Moving Average Convergence Divergence) and moving average are popular technical analysis tools used by traders to identify trends and make informed trading decisions. Although they serve different purposes, they can be used together for effective trading strategies.
MACD is a momentum indicator that consists of two lines - the MACD line and the signal line. The MACD line is calculated by subtracting the 26-day exponential moving average (EMA) from the 12-day EMA. The signal line is a 9-day EMA of the MACD line. The MACD line crossing above the signal line is considered a bullish signal, while crossing below is considered bearish.
Moving average is a trend-following indicator that smoothes out price fluctuations over a specific period of time. It is calculated by adding the closing prices of a stock or asset over a chosen number of periods and dividing it by the number of periods used. The most common periods used are the 50-day and 200-day moving averages.
Read Also: Key Times to Trade Forex: When is Forex Most Important?
Combining MACD and moving average can provide traders with a more comprehensive analysis of the market and increase the accuracy of their trading decisions. When using both indicators together, traders can look for crossovers between the MACD line and the signal line as confirmation of a trend. They can also use the moving average to determine the overall direction of the market.
For example, if the MACD line crosses above the signal line while the price is above the 50-day moving average, it may indicate a strong bullish trend. On the other hand, if the MACD line crosses below the signal line and the price is below the 200-day moving average, it may indicate a strong bearish trend.

By understanding MACD and moving average and how they can work together, traders can gain insights into the market trends and make more informed trading decisions. However, it is important to remember that no indicator or combination of indicators can guarantee profitable trades, and traders should always use proper risk management techniques.
MACD stands for Moving Average Convergence Divergence. It is a popular technical indicator used by traders to identify potential buy and sell signals. MACD is calculated by subtracting the 26-day exponential moving average (EMA) from the 12-day EMA. The result is then plotted on a chart along with a 9-day EMA, which is called the signal line. When the MACD line crosses above the signal line, it generates a buy signal, and when it crosses below the signal line, it generates a sell signal. Traders use MACD to confirm trends, identify reversals, and generate entry and exit points.
Moving averages are a popular technical analysis tool used by traders to smooth out the price data and identify trends over a specific period of time. It is calculated by taking the average price of a security over a specified number of periods. For example, a 50-day moving average is calculated by adding up the closing prices of the last 50 days and dividing by 50. Moving averages are used to identify support and resistance levels, as well as generate buy and sell signals. They are often used in combination with other indicators, such as MACD, to enhance trading strategies.
To effectively combine MACD and moving averages for trading, traders can use them in conjunction to confirm signals and identify trends. For example, when the MACD line crosses above the signal line and the price is above a moving average, it can be a strong buy signal. Conversely, when the MACD line crosses below the signal line and the price is below a moving average, it can be a strong sell signal. By using both indicators together, traders can increase the probability of successful trades and minimize false signals.
There are several common strategies for combining MACD and moving averages. One popular strategy is the MACD crossover, which involves waiting for the MACD line to cross above or below the signal line, and then confirming the signal with a moving average crossover. For example, if the MACD line crosses above the signal line and the price is above a moving average, it can be a buy signal. Another strategy is the MACD divergence, which involves looking for divergences between the MACD line and the price to identify potential trend reversals. Traders can also use multiple moving averages and the MACD to confirm trends and generate signals.
While MACD and moving averages can be effective tools for trading, there are some limitations and risks to consider. One limitation is that these indicators are based on historical data and may not always accurately predict future price movements. Traders should also be cautious of false signals, which can occur during periods of low volatility or when the market is trending sideways. Additionally, using too many indicators or relying solely on technical analysis can lead to overtrading and losses. It is important for traders to carefully analyze the market and consider other factors, such as fundamental analysis and market sentiment, when making trading decisions.

Exploring the Interest in Forex Leverage Forex trading has always been an enticing opportunity for investors and traders due to its potential for high …
Read Article
Introduction to the Gorilla Trading Strategy The world of trading can be both exhilarating and overwhelming. With so many different strategies out …
Read Article
Exploring Currency Momentum Trading Strategies Momentum trading is a popular strategy utilized by traders in currency markets. It is based on the idea …
Read Article
Calculating Weighted Moving Average Volume: A Comprehensive Guide Weighted Moving Average Volume (WMAV) is a popular technical analysis tool used by …
Read Article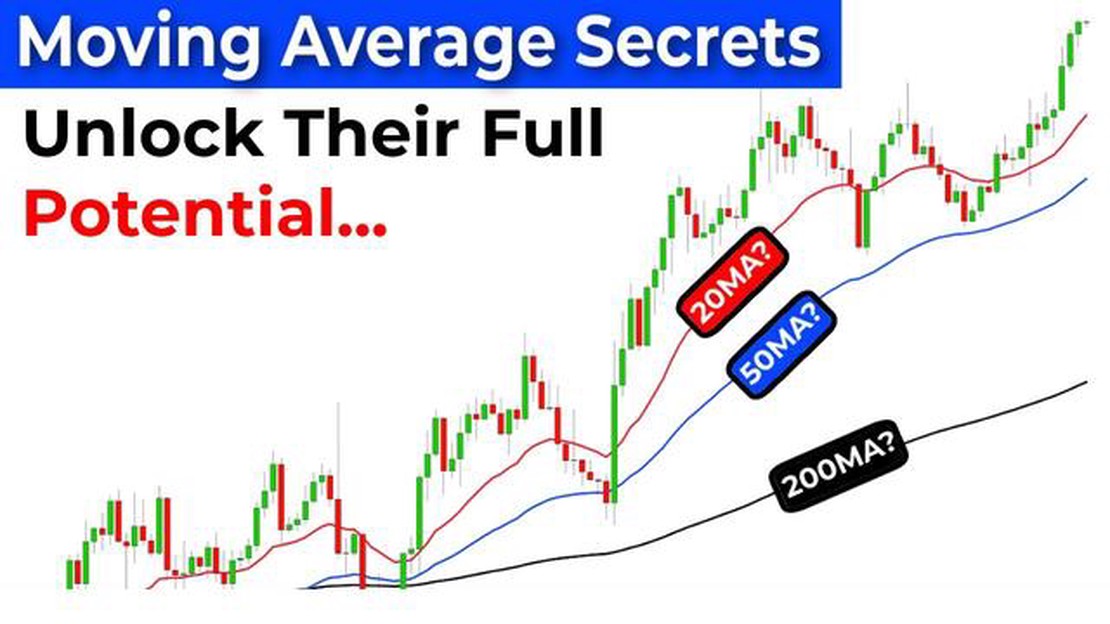
Understanding the EMA Indicator: A Comprehensive Guide Technical analysis is an essential tool for traders and investors to make informed decisions in …
Read Article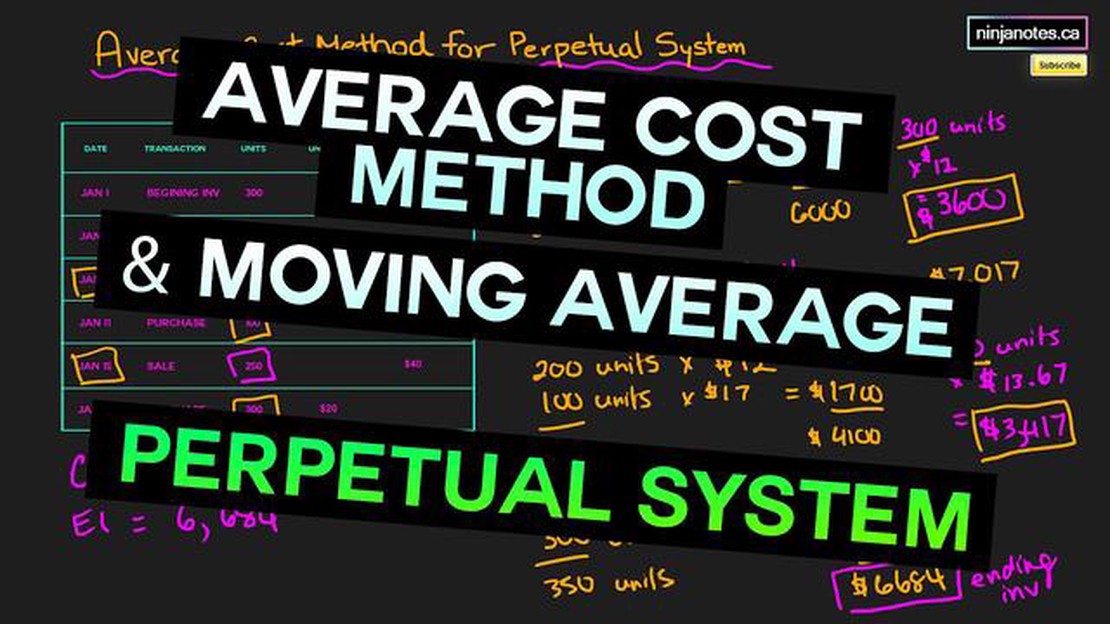
How to Calculate Moving Average Cost of Inventory Inventory management is a crucial aspect of any business, and one key metric that helps businesses …
Read Article


