


Understanding the 1000 Standard Lot Size in Forex Trading
What is 1000 standard lot size in forex? Forex trading is a fascinating and complex market that offers significant opportunities for profit. One …
Read Article
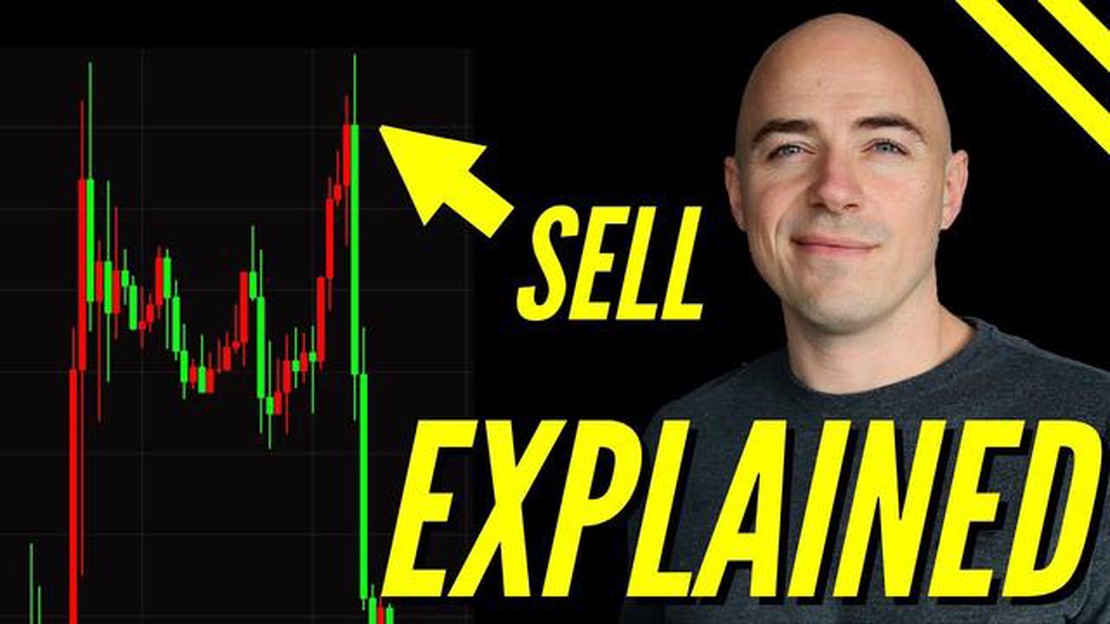
The double bottom pattern is a popular and reliable chart pattern in technical analysis. It is formed when a security’s price experiences two distinct lows that are approximately equal with a moderate peak in between. This pattern is considered to be a bullish reversal pattern, indicating a potential trend reversal from a downtrend to an uptrend.
Traders and investors look for the double bottom pattern as it provides valuable information about the market sentiment and potential buying opportunities. The significance of this pattern lies in its ability to signal the end of a downward trend and the start of a new uptrend. It suggests that the selling pressure has exhausted, and buyers are stepping in to drive the price higher.
Identifying a double bottom pattern involves several key elements. First, the price should create two distinct lows, preferably at approximately the same level. Second, a moderate peak should form between the two lows, known as the “neckline.” Finally, the price should break above the neckline, confirming the pattern’s validity.
Once the double bottom pattern is confirmed, traders can use it to determine the potential target price. This can be done by measuring the vertical distance between the lowest low and the neckline and adding it to the breakout level. Additionally, traders may use other technical indicators and patterns to validate the double bottom pattern and strengthen their trading decision.
Overall, understanding the meaning and significance of a double bottom pattern is vital for technical analysts and traders. This pattern can provide valuable insight into potential trend reversals and buying opportunities in the market. By correctly identifying and interpreting double bottom patterns, traders can enhance their trading strategies and increase the likelihood of profitable trades.
A double bottom pattern is a technical chart pattern that is commonly used in technical analysis to identify a potential trend reversal and indicate that the price of an asset may be nearing a bottom. It is a bullish reversal pattern, appearing after a downtrend, and consists of two consecutive lows that are roughly equal, with a moderate pullback in between.
The pattern gets its name from the two bottom points that form on the chart, representing the support level at which buyers have stepped in and prevented the price from falling further. The first bottom is formed when the price reaches a low point and starts to bounce back, but fails to make a significant upward move. The price then retraces back to another similar level, forming a second low, before finally breaking out above the resistance level.
Read Also: Are options eligible for tax loss harvesting?
Traders and investors look for this pattern as it signals a potential reversal in sentiment and a shift from bearish to bullish. It suggests that the selling pressure has exhausted and buying interest is starting to build up. When the price breaks above the resistance level after the second bottom, it confirms the pattern and provides a buy signal.
It is important to note that the reliability and effectiveness of the double bottom pattern can vary, and it should always be used in conjunction with other technical indicators and analysis tools to confirm the validity of the pattern and make informed trading decisions.
The double bottom pattern is a technical analysis chart pattern used in trading and investing. It is identified by two distinct low points, or bottoms, forming a “W” shape on a price chart. This pattern is considered a bullish reversal pattern, indicating a potential trend reversal from a downtrend to an uptrend.
Characteristics of a double bottom pattern include:
By understanding the definition and characteristics of a double bottom pattern, traders can identify potential entry points and potentially profit from bullish trend reversals. However, it is important to note that no pattern or indicator guarantees success, and it is always advisable to use additional analysis and risk management techniques when making trading decisions.
A double bottom pattern is a chart pattern that occurs in technical analysis when the price of an asset or security creates two consecutive lows at approximately the same level, followed by a price reversal. It is considered a bullish reversal pattern.
Read Also: Can Anyone Join Forex? Find out How to Enter the Forex Market
To identify a double bottom pattern, you should look for two price lows that are about the same distance apart, with a peak in between. The price should then bounce back up from the second low, indicating a potential reversal. It is recommended to use other technical indicators and confirmations to verify the pattern.
A double bottom pattern is significant because it often indicates a reversal in the price trend of an asset or security. It suggests that the buying pressure has become stronger than the selling pressure, and that the price is likely to start an upward movement. Traders and investors can use this pattern to identify potential buying opportunities.

While a double bottom pattern can indicate a potential trend reversal, it does not guarantee future price movements. It is important to use other technical analysis tools and indicators, as well as consider fundamental factors, to make more informed predictions about future price movements.
Yes, there are variations of the double bottom pattern, such as the “triple bottom” and the “rounded bottom”. These patterns have similar characteristics to a double bottom, but with additional lows or a smoother curve. Each variation may have slightly different implications and significance.
A double bottom pattern is a chart pattern in technical analysis which signals a reversal from a downtrend to an uptrend. It consists of two consecutive lows that are approximately equal, which are separated by a peak in between.

What is 1000 standard lot size in forex? Forex trading is a fascinating and complex market that offers significant opportunities for profit. One …
Read Article
Is a Forex Card Necessary for International Travel? When planning an international trip, it’s important to consider the various payment options …
Read Article
Is there a stock exchange in Ukraine? Ukraine, with its rapidly growing economy and European aspirations, has a thriving financial market. One of the …
Read Article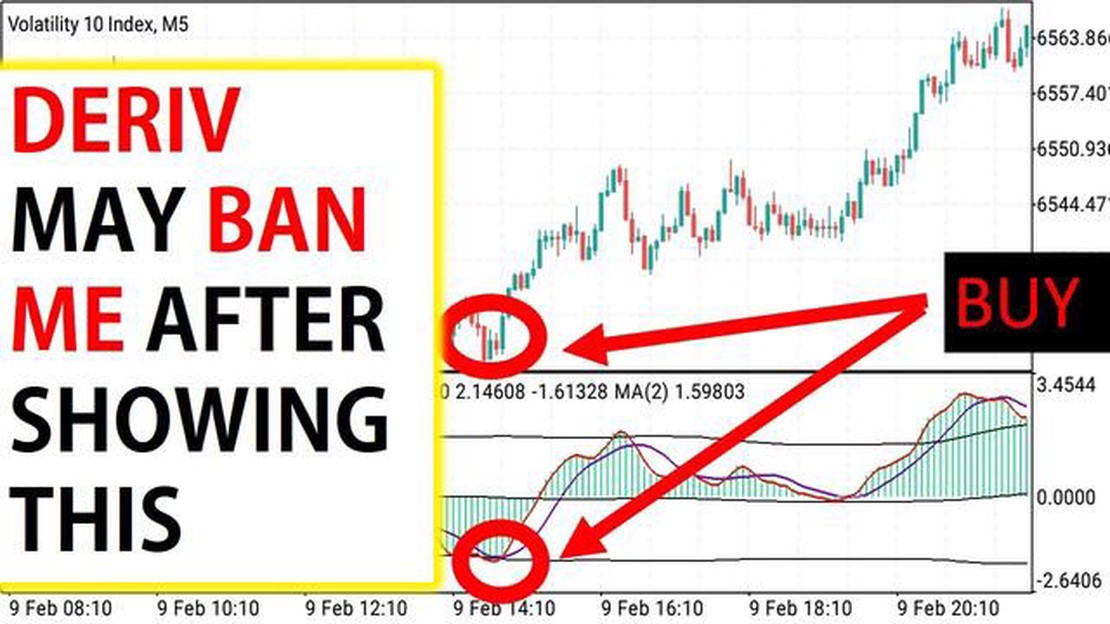
What is the Signal of Volatility 10 Index? Volatility has always been a fascinating concept in the world of finance. It represents the degree of …
Read Article
Is InstaForex available for US clients? Forex trading is a popular investment option for many people, offering the potential for high returns on …
Read Article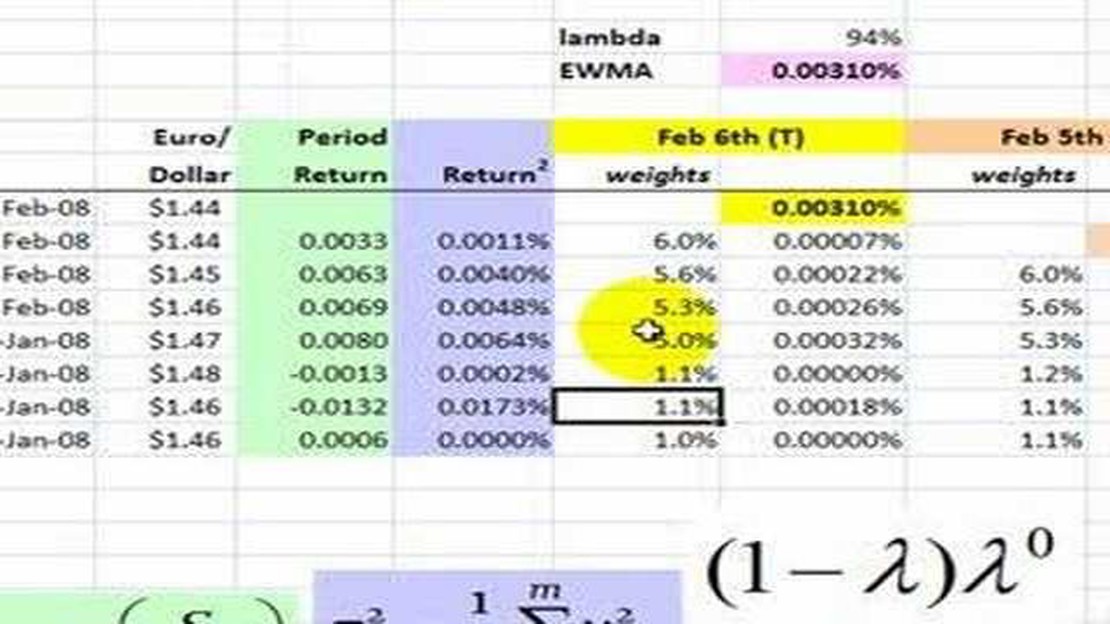
Discover the Exponentially Weighted Moving Average Calculation In the field of statistics and finance, the Exponentially Weighted Moving Average …
Read Article


