The Guppy Multiple Moving Average (GMMA) indicator is a powerful tool that can be used by traders to identify trends and make informed trading decisions. Developed by Daryl Guppy, the GMMA indicator is based on the concept that markets are made up of two groups of traders - investors and traders. By analyzing the behavior of these two groups, the GMMA indicator can help traders identify when to enter and exit trades.
Table Of Contents
The GMMA indicator consists of two sets of moving averages - the short-term group and the long-term group. The short-term group consists of 3, 5, 8, 10, 12, and 15-day exponential moving averages (EMAs), while the long-term group consists of 30, 35, 40, 45, 50, and 60-day EMAs. The short-term moving averages represent the behavior of traders, while the long-term moving averages represent the behavior of investors.
When the short-term moving averages move away from the long-term moving averages, it indicates that traders are dominating the market and a new trend may be forming. Conversely, when the short-term moving averages converge with the long-term moving averages, it suggests that the market is consolidating or reversing.
Traders can use the GMMA indicator to identify the strength of a trend and make trading decisions based on this information. For example, when the short-term moving averages are above the long-term moving averages and are widening, it suggests that there is a strong uptrend and traders may consider going long. On the other hand, when the short-term moving averages are below the long-term moving averages and are narrowing, it indicates a strong downtrend and traders may consider going short.
In addition to identifying trends, the GMMA indicator can also be used to determine support and resistance levels. When the short-term moving averages cross above the long-term moving averages, it suggests a potential support level, while a cross below indicates a potential resistance level. Traders can use these levels to set stop-loss orders and take-profit targets.
In conclusion, the GMMA indicator is a valuable tool for traders looking to identify trends and make informed trading decisions. By analyzing the behavior of traders and investors, the GMMA indicator can provide valuable insights into market trends and help traders enter and exit trades at the right time.
Understanding the GMMA Indicator
The GMMA (Guppy Multiple Moving Average) indicator is a popular technical analysis tool used by traders to identify trends and potential entry and exit points in the financial markets. It was developed by Daryl Guppy, an Australian trader and author, and is based on the concept of multiple moving averages.
The GMMA indicator consists of two sets of moving averages – the short-term moving averages (STMA) and the long-term moving averages (LTMA). The STMA set includes 3, 5, 8, 10, 12, and 15-period moving averages, while the LTMA set includes 30, 35, 40, 45, 50, and 60-period moving averages.
The idea behind the GMMA indicator is that the short-term moving averages represent the actions of short-term traders and speculators, while the long-term moving averages represent the actions of long-term investors and institutional traders. By plotting these moving averages on a chart, traders can identify the strength and direction of the trend based on the convergence or divergence of the moving averages.
When the short-term moving averages are above the long-term moving averages, it indicates a bullish trend, while when the short-term moving averages are below the long-term moving averages, it indicates a bearish trend. The convergence of the moving averages suggests a strengthening trend, while the divergence of the moving averages suggests a weakening trend.
Traders can use the GMMA indicator in various ways. They can use it to identify trend reversals, as a confirmation tool for other technical indicators, and to determine potential support and resistance levels. Additionally, traders can combine the GMMA indicator with other technical analysis tools to develop a comprehensive trading strategy.
It’s important to note that while the GMMA indicator can be a useful tool in technical analysis, it should not be relied upon solely for making trading decisions. Traders should always consider other factors such as market conditions, price patterns, and fundamental analysis before entering or exiting a trade.
In conclusion, the GMMA indicator is a powerful tool for traders looking to identify trends and potential entry and exit points in the financial markets. By understanding how the indicator works and using it in conjunction with other technical analysis tools, traders can increase their chances of making successful trades.
What is the GMMA Indicator?
The GMMA (Guppy Multiple Moving Averages) indicator is a technical analysis tool that consists of a collection of exponential moving averages (EMAs) to provide a visual representation of the market trend. Developed by Daryl Guppy, this indicator is widely used by traders to identify potential trend reversals and trade opportunities.
The GMMA indicator is composed of two different sets of moving averages: the long-term group and the short-term group. The long-term group consists of longer time frame EMAs, while the short-term group consists of shorter time frame EMAs. This combination of moving averages helps in analyzing the strength and direction of the trend.
When the short-term moving averages are located below the long-term moving averages, it indicates a bullish trend, suggesting that prices are likely to continue rising. Conversely, when the short-term moving averages are positioned above the long-term moving averages, it indicates a bearish trend, suggesting that prices are likely to decline further.
The GMMA indicator also helps traders identify potential support and resistance levels. When the short-term moving averages start to converge towards the long-term moving averages, it indicates that the market is approaching a potential reversal point. Conversely, when the short-term moving averages start to diverge from the long-term moving averages, it suggests that the trend is gaining momentum.
Traders can use the GMMA indicator in various ways, including trend identification, entry and exit signals, and confirmation of market trends. By understanding the visual representation provided by the GMMA indicator, traders can make informed decisions when entering or exiting trades, increasing their chances of success.
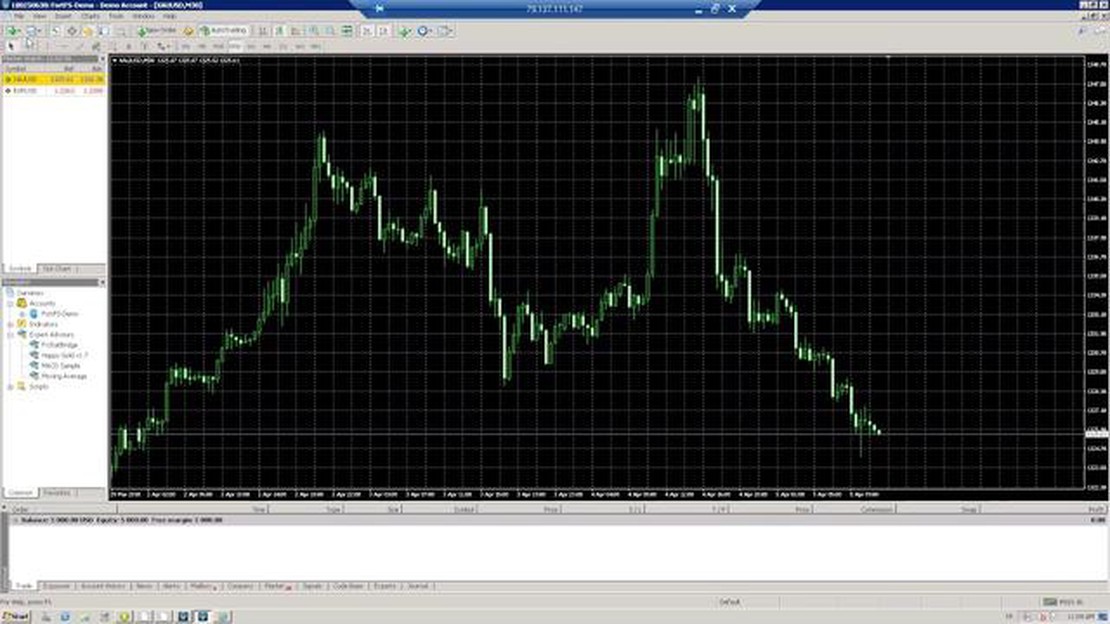
GMMA Indicator
FAQ:
What is the GMMA indicator?
The GMMA indicator, also known as the Guppy Multiple Moving Average, is a technical analysis tool used in trading to identify trends and potential buy or sell signals.
How does the GMMA indicator work?
The GMMA indicator works by plotting multiple moving averages on a chart, with the shorter-term moving averages representing the short-term trend and the longer-term moving averages representing the long-term trend. Traders look for crossovers and divergences between these moving averages to generate trading signals.
What time frame should I use when using the GMMA indicator?
The time frame you should use when using the GMMA indicator depends on your trading strategy and preferences. Short-term traders may use smaller time frames like 5 or 15 minutes, while long-term traders may use daily or weekly charts. It’s important to experiment and find a time frame that works best for you.
Can the GMMA indicator be used for any financial market?
Yes, the GMMA indicator can be used for any financial market, including stocks, commodities, forex, and cryptocurrencies. The concept of identifying trends and trading signals based on moving averages applies to all markets.
Are there any disadvantages or limitations to using the GMMA indicator?
Yes, there are a few disadvantages and limitations to using the GMMA indicator. It can sometimes generate false signals in choppy or sideways markets. Additionally, it’s important to use the GMMA indicator in conjunction with other technical analysis tools and indicators for confirmation and to avoid relying solely on it for trading decisions.
What is the GMMA indicator?
The GMMA indicator stands for the Guppy Multiple Moving Average. It is a technical analysis tool that uses multiple moving averages to identify the direction of a trend and potential areas of support and resistance.
How do I use the GMMA indicator?
To use the GMMA indicator, you first need to add it to your trading platform. Then, you can adjust the settings to customize the number of moving averages and the time periods used. Once added, the indicator will plot the moving averages on your chart, and you can analyze their positioning and interaction to make trading decisions.
Understanding the GMT Offset for Forex Brokers When it comes to forex trading, understanding the GMT offset is crucial. The GMT offset, also known as …
Understanding the Payment Processing System in Forex Trading Forex, or foreign exchange, is a decentralized market where currencies are traded. It is …